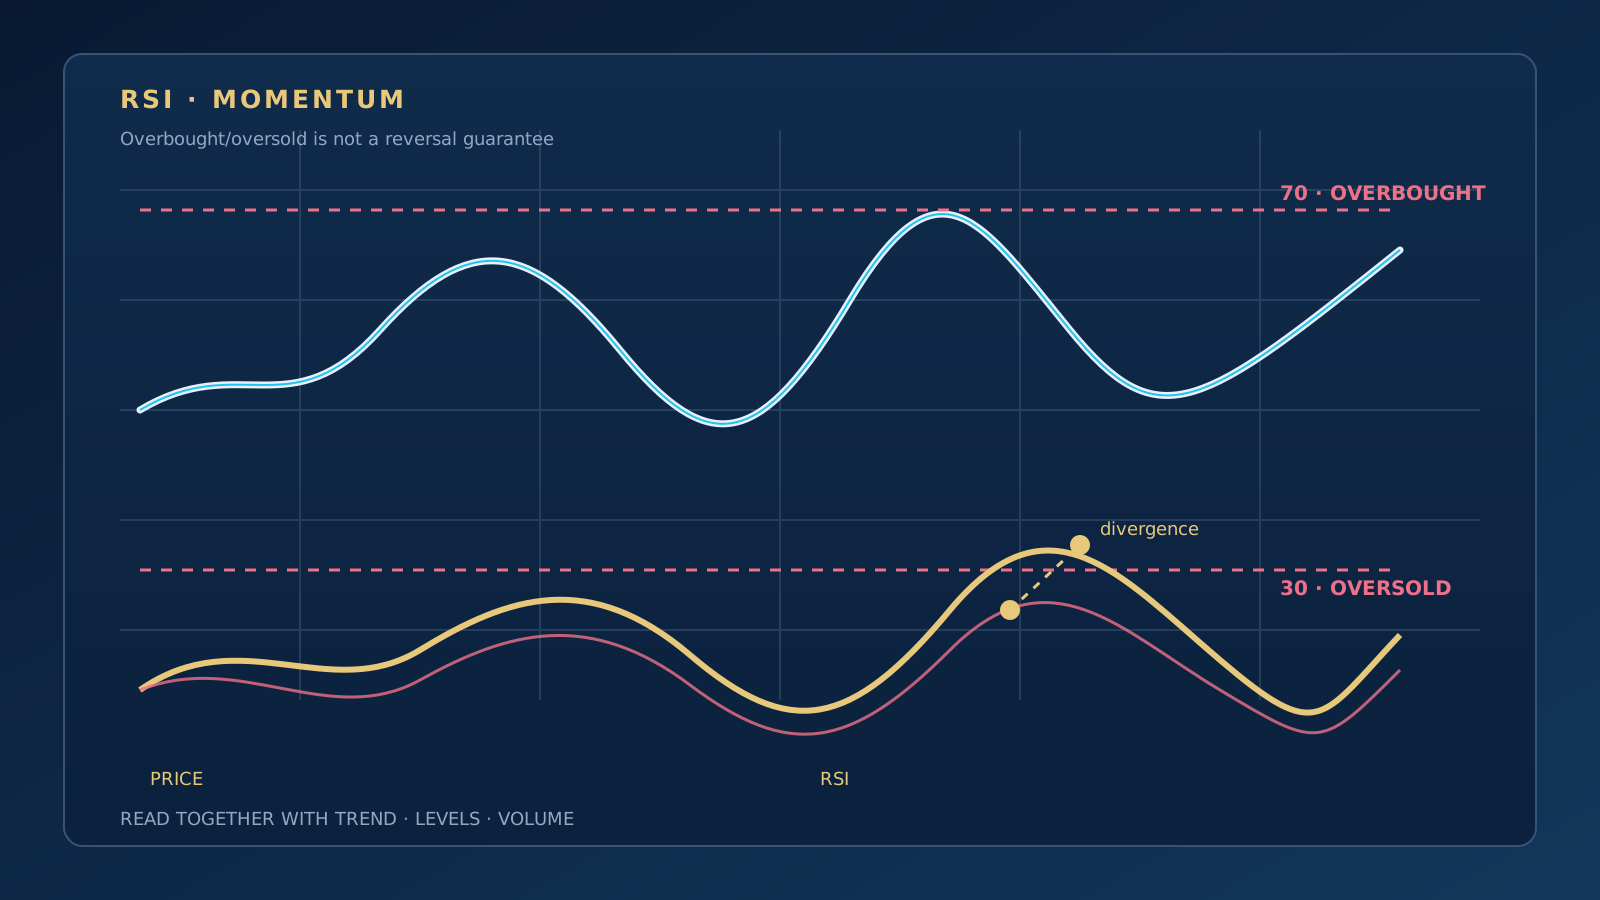
RSI (Relative Strength Index) is a bounded oscillator used to evaluate the momentum and rate of change of a price move. The indicator moves between 0 and 100, and readings above 70 are generally watched as the overbought zone and readings below 30 as the oversold zone.
These levels are not automatic reversal orders. In a strong uptrend, RSI can stay above 70 for a long time; in a downtrend it can remain below 30. RSI should be read together with price structure, support and resistance, trend and volume.
How Is RSI Calculated?
RSI compares the average gain with the average loss over a given period. The most common setting is 14 periods. The simplified formula is as follows:
RSI = 100 - (100 / (1 + RS))
Here RS is the ratio of the average gain to the average loss. As the period gets shorter, the indicator becomes faster and choppier; as it gets longer, it becomes slower and calmer.
What Do the 70 and 30 Levels Mean?
- Above 70: Recent bullish momentum may be strong; this does not mean price will fall immediately.
- Below 30: Recent bearish momentum may be strong; this does not mean price will rise immediately.
- Around 50: Can be watched as the middle zone for the direction of momentum, but it is not a trend filter on its own.
Reaching a level and turning back from it are different things. RSI leaving a zone can form a more meaningful scenario when it is evaluated together with the behaviour of price at an important level.
How Is RSI Read in Strong Trends?
In strong trends, the overbought and oversold zones can hold for longer than expected. In a rising market RSI can spend more of its time in the 40-90 range, and in a falling market in the 10-60 range. For this reason, opening trades against the trend based only on the 70 and 30 thresholds is risky.
First determine the trend using trend lines and the structure of price highs and lows. Then examine whether RSI is gaining or losing strength within that structure.
What Is RSI Divergence?
Divergence is when price and RSI move in different directions. When price makes a higher high while RSI forms a lower high, bearish divergence is investigated; when price makes a lower low while RSI forms a higher low, bullish divergence is investigated.
- Bearish divergence: Suggests that bullish momentum may be weakening.
- Bullish divergence: Suggests that bearish momentum may be weakening.
Divergence usually does not tell you when the reversal will happen. It can persist for a long time while price keeps moving in the direction of the trend. For this reason divergence should be treated as an alert or a watch signal, not as the sole reason for a trade.
Which Timeframe Is RSI Used On?
RSI can be used on all timeframes, but the meaning of a signal changes with the chart selected. Lower timeframes show more noise and short-lived overbought and oversold readings. On higher timeframes signals form less often, but they can reflect the broader market structure.
- Use the higher timeframe for overall direction and main levels.
- Examine the lower timeframe only to see the details of the scenario.
- Do not carry the same RSI setting to different markets without questioning it.
How Does RSI Combine with Support and Resistance?
RSI being in the overbought zone may not indicate weakness on its own if price is not at resistance. Similarly, when RSI is oversold but price is far from strong support, a bullish scenario may not form.
First identify the support and resistance zones. Then examine whether RSI shows a loss or gain of momentum in that zone. Volume can also provide additional information about the participation behind the price reaction.
The Difference Between RSI and ALA V2
RSI is a general-purpose, standard momentum oscillator. ALA V2, on the other hand, is a specialised analysis system that examines momentum data across different timeframes, divergence classes and a projection approach.
This difference does not mean that one is necessarily superior to the other. RSI offers a clear starting point for basic momentum reading; those who want more detailed analysis should test separately what different measurements add.
Common Beginner Mistakes
- Selling immediately at 70: In strong trends RSI can stay high for a long time.
- Buying immediately at 30: In a downtrend, oversold can become even more oversold.
- Treating divergence as a certain reversal: Divergence is a possible change in momentum, not a direction.
- Changing the period without testing: A faster RSI is not more accurate, only more sensitive.
- Ignoring price: RSI does not replace price structure.
Quick Summary
RSI helps you understand the strength of momentum and changes in its speed. The 70 and 30 levels are areas of attention, not definite reversal points. The healthiest way to use RSI is to evaluate it together with trend, support and resistance, the close and volume.
To learn the fundamentals behind momentum, continue with What Is Technical Analysis?, and to look at volume confirmation, read What Is Volume Analysis?.

More than twenty years of market experience, specialising in Gann analysis. Builds TradingView indicators and MetaTrader 5 automation software, and teaches one-to-one.
About →