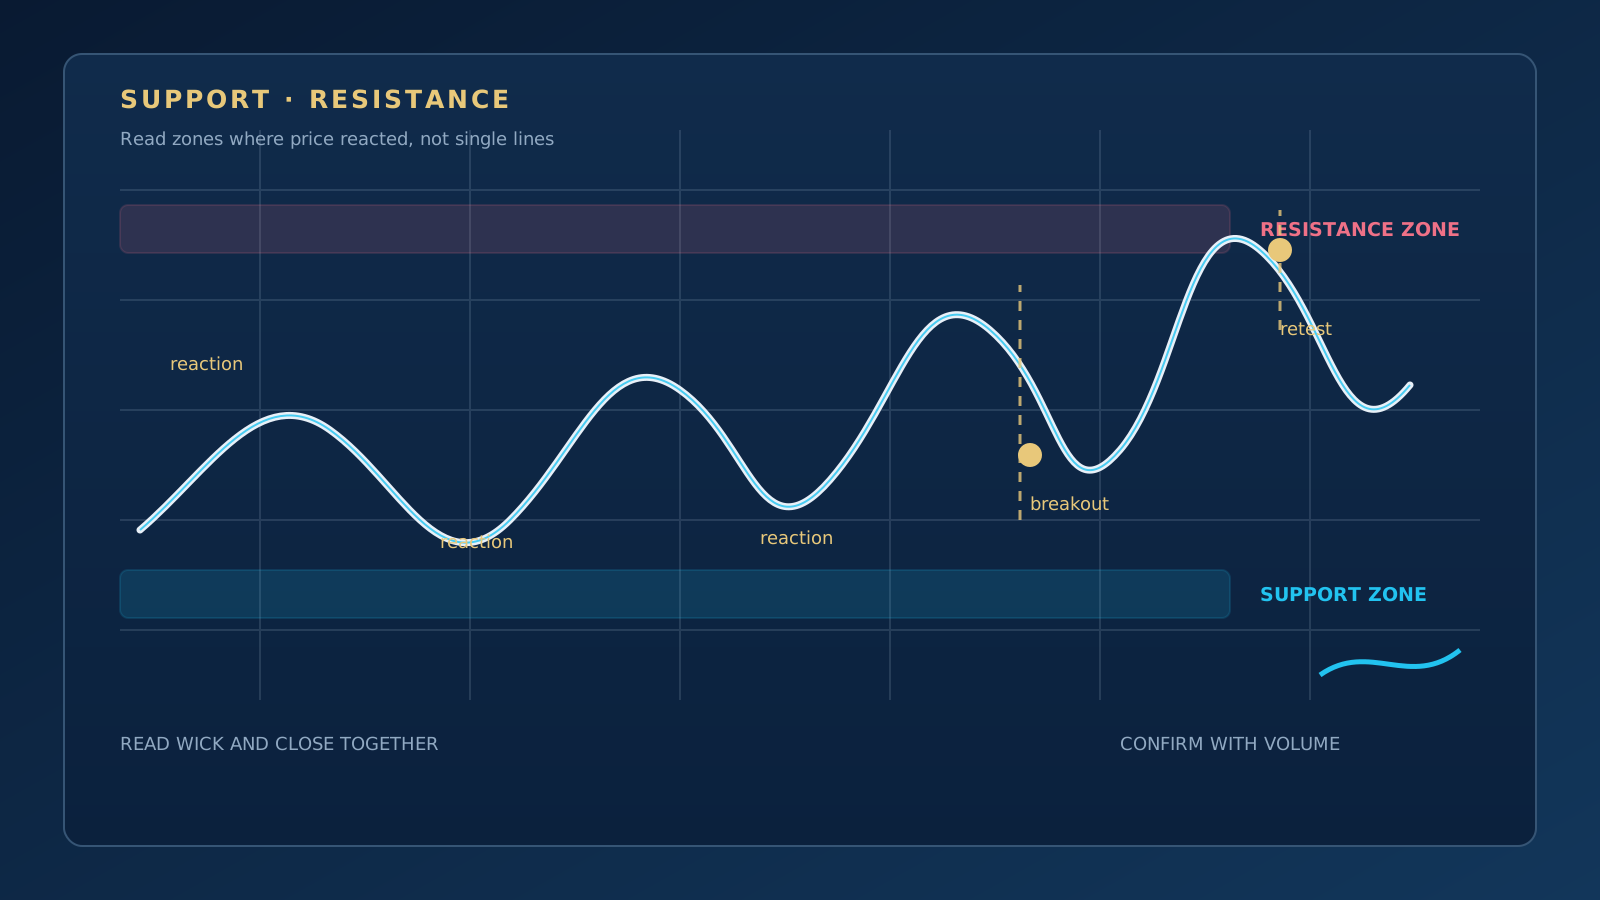
Support and resistance are core concepts in technical analysis used to understand the zones where price has reacted before. Support refers to an area where buyers can strengthen during a decline; resistance refers to an area where sellers can come forward during a rally.
These levels do not tell you the future with certainty. When price returns to the same zone it may react, break through, or overshoot briefly and then turn back. That is why it is healthier to read support and resistance not as a single line but as a price zone that needs to be tested.
What Is Support?
Support is the zone where a decline slows down or buyers show renewed interest. A previous low, a horizontal consolidation area, a price range with heavy trading activity or a rising trend line can all be watched as support.
- Reaction: When price reaches the support zone, buyers may strengthen and the move may pause briefly.
- Breakout: If price fails to hold in the zone and closes below it, support may lose its validity.
- Retest: Broken support may later be tested as resistance; this behaviour does not always occur.
What Is Resistance?
Resistance is the zone where price struggles during a rally or where sellers have been active before. Previous highs, the upper boundary of horizontal ranges and falling trend lines can be tracked as resistance.
A rejection from a resistance zone suggests that sellers are strong at that moment. But the more often resistance is tested does not mean it will necessarily break; volume, the close and market conditions should be re-evaluated on every test.
Line or Zone?
Marking an exact price on a chart is easy; in the market, trades are usually spread across several price levels. That is why using a narrow band for support and resistance is more realistic than relying on a single number.
- Several wicks turning back in the same range can increase the importance of the zone.
- Closes clustering around the same price show where the balance between buyers and sellers lies.
- Zones that are too wide make decisions harder; the zone should be scaled to the volatility of the market.
How to Draw Support and Resistance
- Start by marking the clear lows and highs on the higher timeframe.
- Identify the ranges where price has reacted more than once and mark them as horizontal zones.
- Check whether the zone is also meaningful on the lower timeframe.
- Rather than forcing the line onto the latest price, make sure it clearly represents past behaviour.
When drawing, it is important to look at the whole chart. Treating a small level formed by only the last few candles as major support or resistance can lead to a context error.
How to Read a Breakout
Price moving above a resistance zone or below support signals the possibility of a breakout. But a wick pushing through the zone and a candle closing outside the zone are not the same thing.
- Wick: A brief overshoot followed by a quick reversal can indicate that the breakout has failed.
- Close: A close outside the zone can make the breakout scenario more meaningful.
- Retest: A return to the old zone after the break provides extra context for evaluating the scenario.
No breakout should be accepted as certain on appearance alone. Volume, volatility, the higher timeframe and the news flow should also be added to the picture.
Can Volume Confirm It?
Volume can help show how much participation there is behind a price move. A high-volume close above resistance may suggest more trading interest behind the breakout. A low-volume move should be watched more carefully.
Even so, this is not confirmation on its own. The way volume data is calculated can differ by market; it should not be interpreted the same way on crypto, stock and forex charts.
Using Them with Trend Lines
Horizontal zones show specific price ranges, while trend lines show the direction of price over time. When the two analyses intersect in the same zone, a noteworthy area can form. However, a trend line should not be assumed more accurate simply because it touches more points; the choice of line depends on the timeframe used and the pivots selected.
Gann angles and fans offer a different approach that studies the relationship between price and time through slopes. When used alongside support and resistance zones, the goal is not to add more lines but to test whether the same zone is supported by different measurements.
Common Beginner Mistakes
- Relying on a single number: Market trades usually take place within a band.
- Treating every touch as a signal: Touching a zone does not mean a certain reversal.
- Mistaking a wick for a close: Whether a breakout holds should be examined separately through the candle close.
- Mixing timeframes: Five-minute support may be insignificant on the daily chart.
- Not setting a stop and an invalidation point: What to do when the scenario fails should be written down in advance.
Quick Summary
Support and resistance are zones where price has reacted in the past and can be watched again in the future. These zones are not trade signals on their own. They should be evaluated together with the trend, the close, volume and the structure on the higher timeframe.
To learn the basic framework of technical analysis, continue with What Is Technical Analysis?, and to explore the price-time approach, read What Is Gann Analysis?.

More than twenty years of market experience, specialising in Gann analysis. Builds TradingView indicators and MetaTrader 5 automation software, and teaches one-to-one.
About →