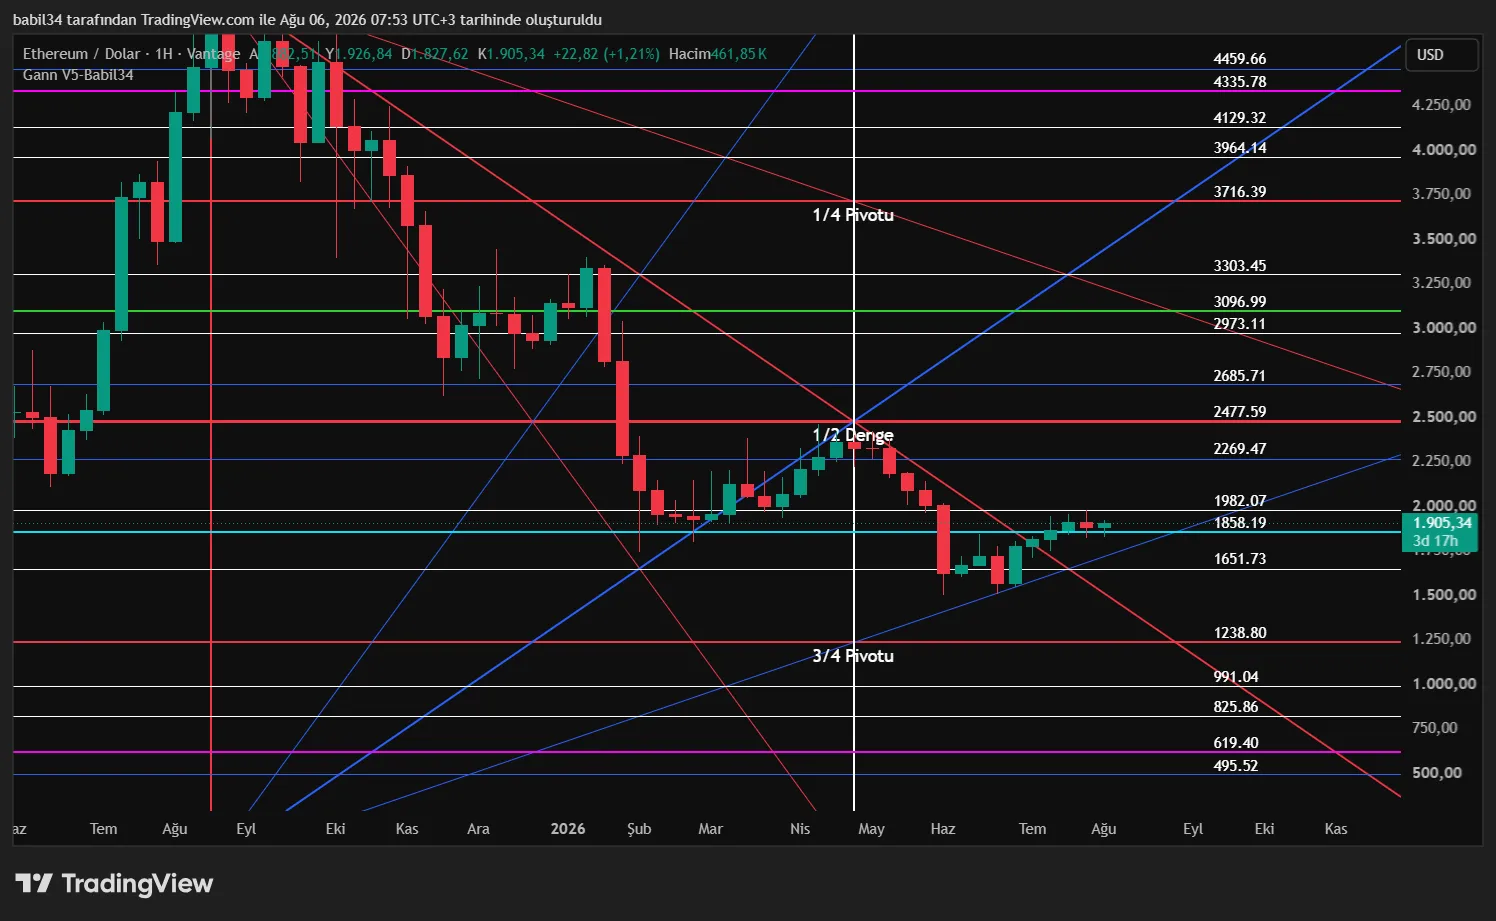
Levels, angles, fans and time cycles - all automatic. Instead of hours of manual drawing on every chart, find it ready the moment you open the chart.
It estimates the direction automatically and aims to reduce false signals with a dynamic ATR-based filter. The critical detail: the filter multiplier changes with the symbol type - wide for crypto, medium for stocks and indices, narrow for forex. Results can vary with market conditions.
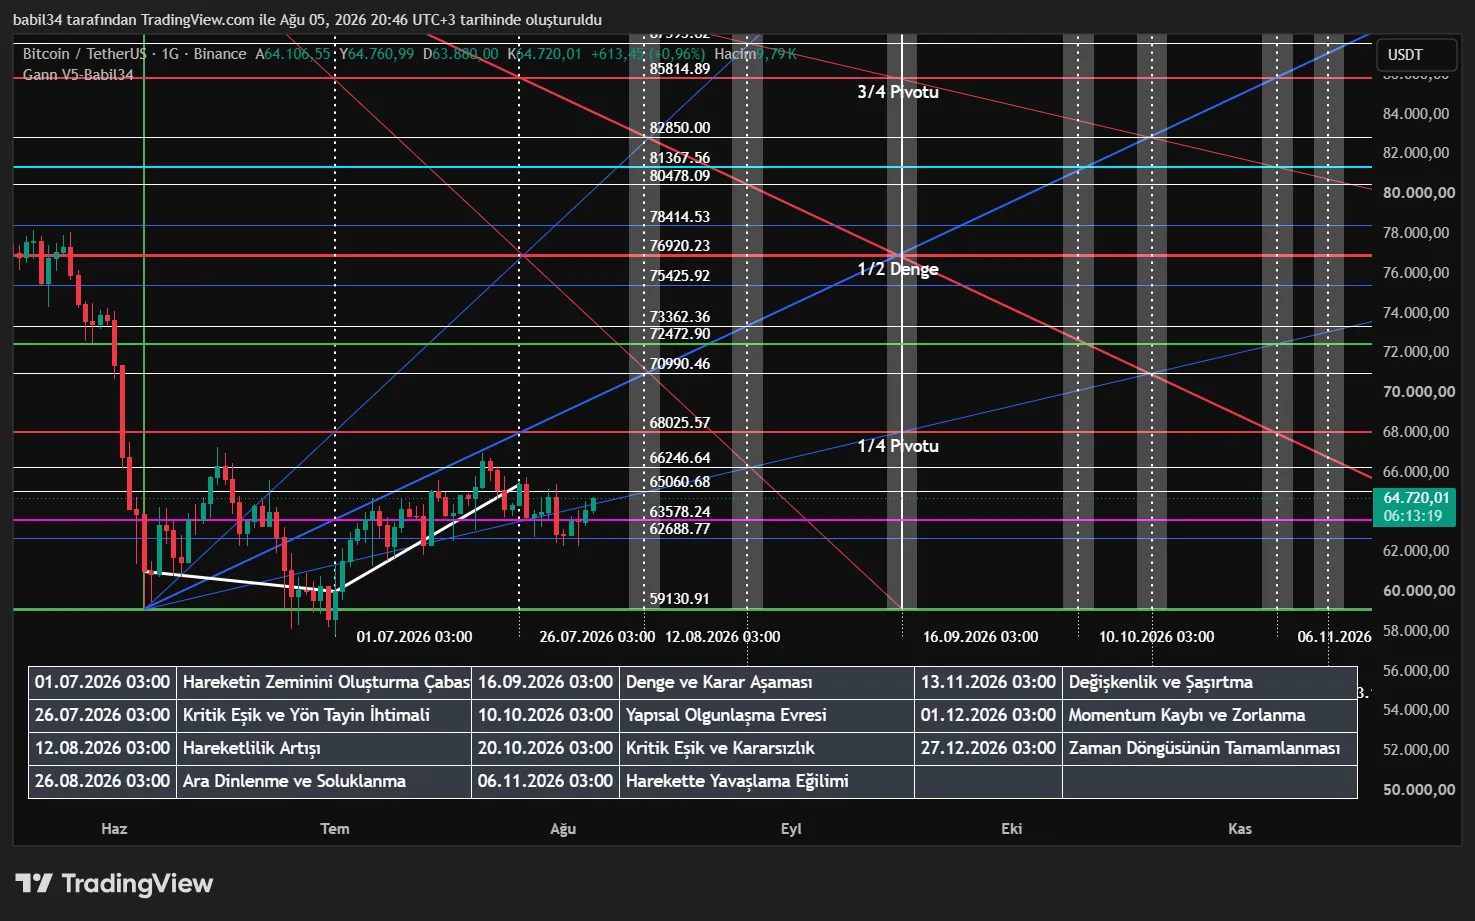
Gann's real legacy was time, not price. The time axis of a move is divided into eleven ratios and the meaning of each is spelled out: "Critical Threshold and Possible Direction Decision", "Balance and Decision Phase", "Completion of the Time Cycle"...
You can set the cycle start yourself, or let the system take it automatically from the equinoxes and solstices (20 March, 21 June, 22 September, 21 December) - faithful to Gann's seasonal approach.
The true lunar phase is calculated from the Julian day and marked on the chart: New Moon, Waxing, Full Moon, Waning. Not an approximate table but an astronomical formula.
Nine fans from 1/8 to 8/1; the colour, thickness and style of each can be set separately. Rising and falling fans can be switched on and off independently.
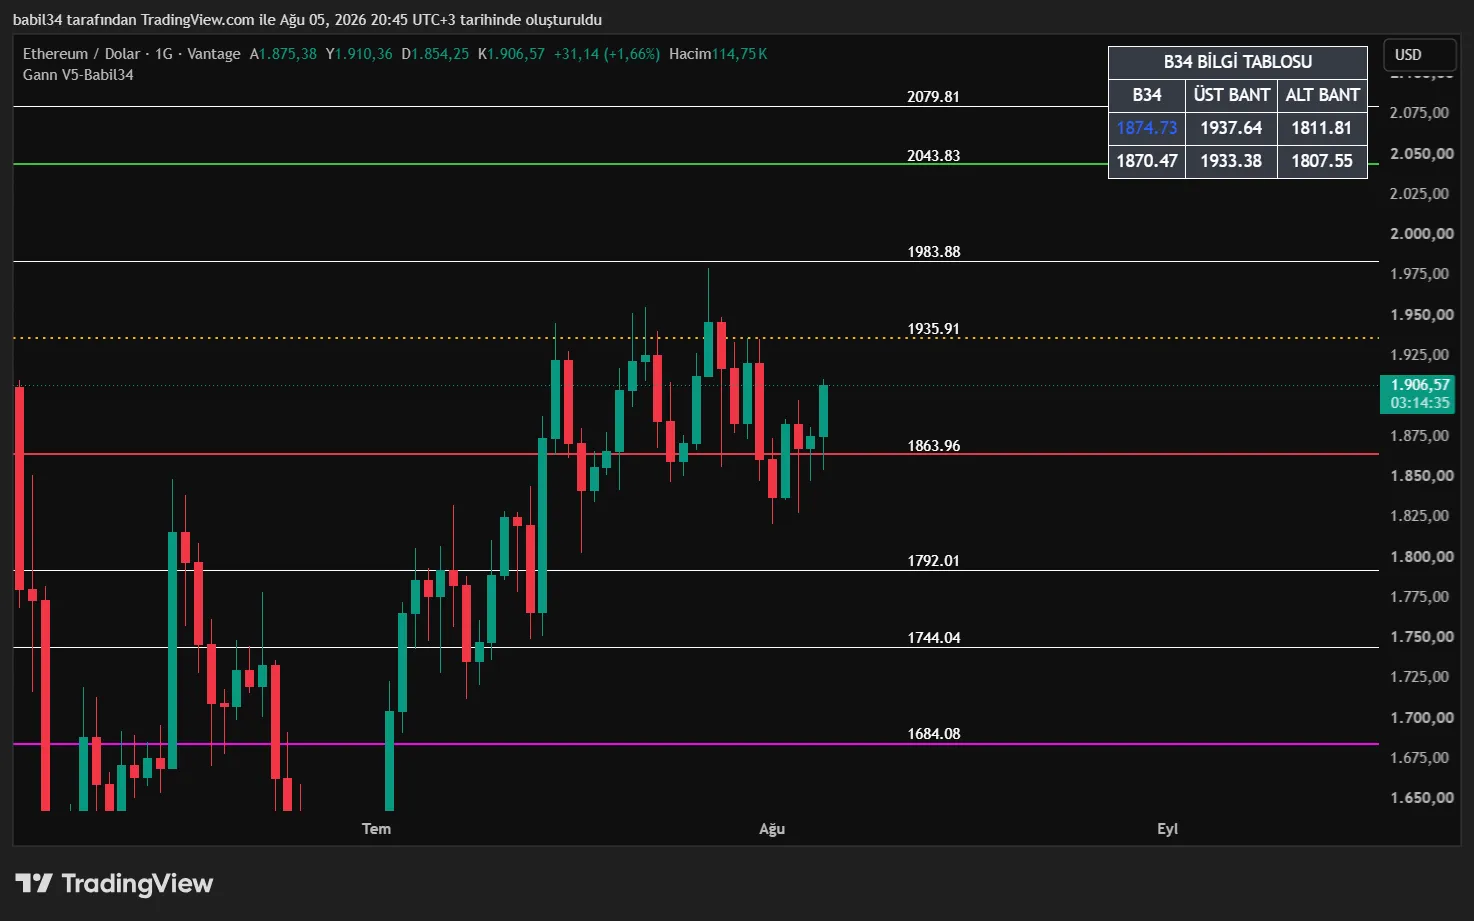
The trend line built into the system: with projection point, dynamic filter band and an info table showing the live values.
When the screen gets crowded, one click simplifies it - only the levels close to price remain. In trade-following mode the angles are added too.
Gann's "squaring of price and time" technique is applied automatically.
Main and fine pivots, extra levels, price labels, percentage distance, Gann angles and box, MTF signal table, percentage-approach alert, automatic adaptation to dark/light themes.
The Time Pattern divides the time axis of a move into ratios and attaches an interpretation to each. In the table below the chart you read which phase is expected on which date - date by date, with its explanation.
The cycle start is taken automatically from the last equinox or solstice; you can also enter your own date.
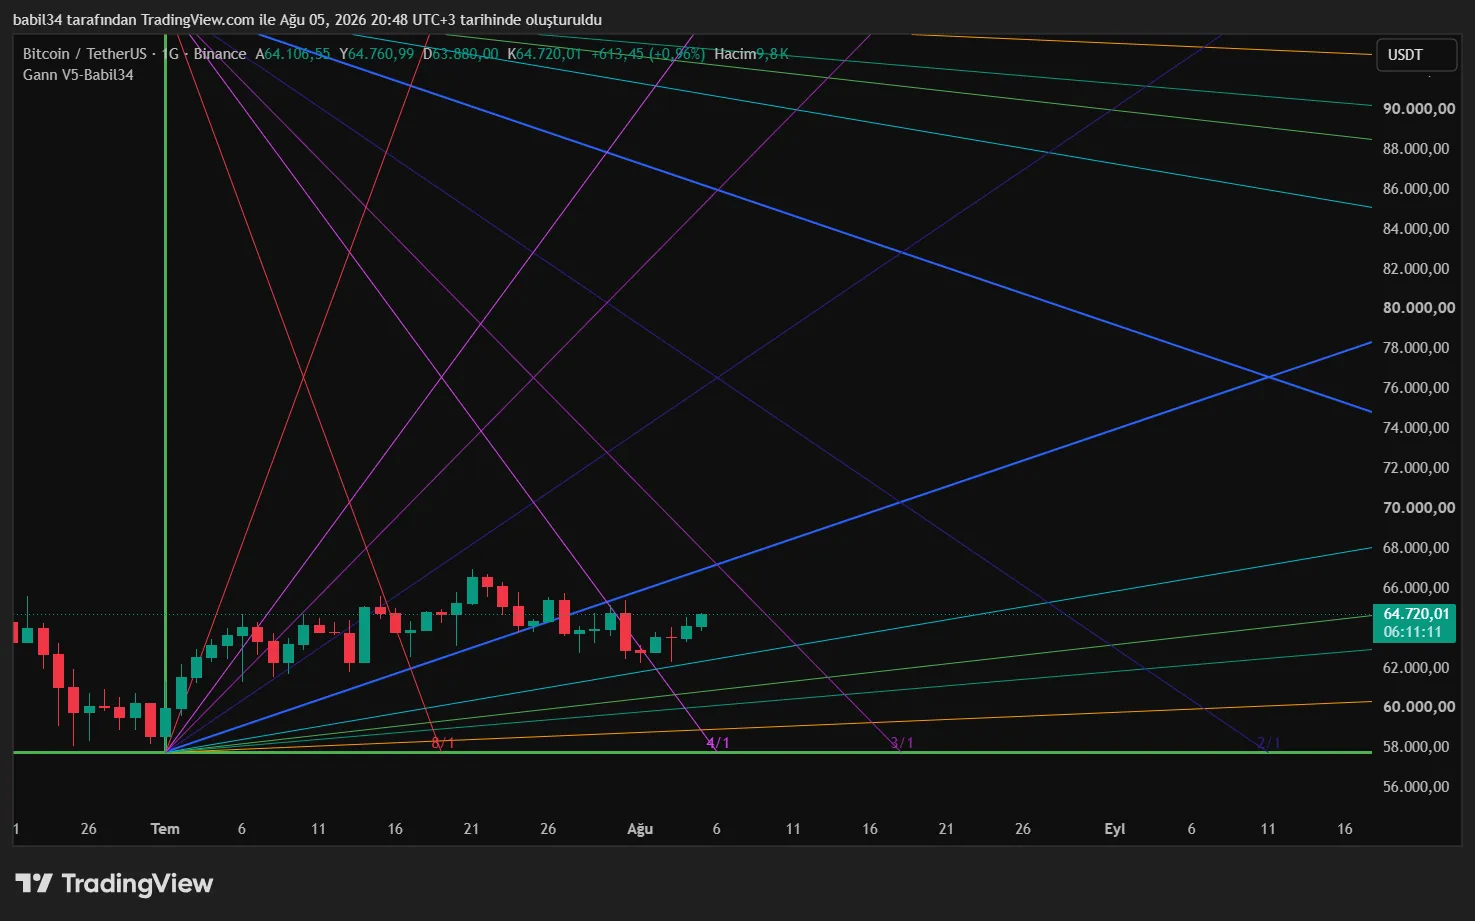
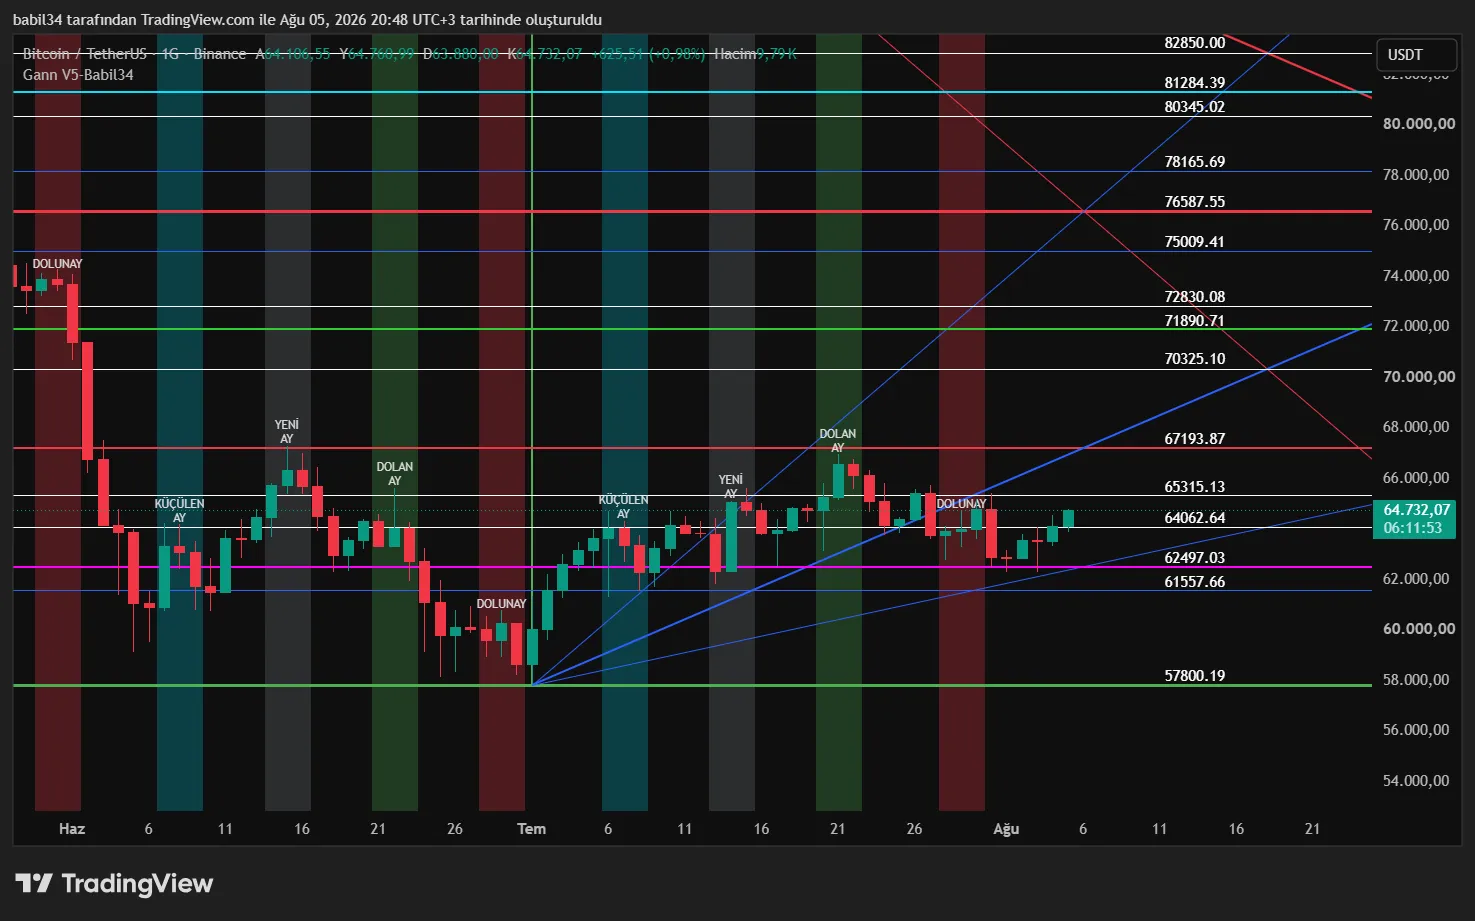
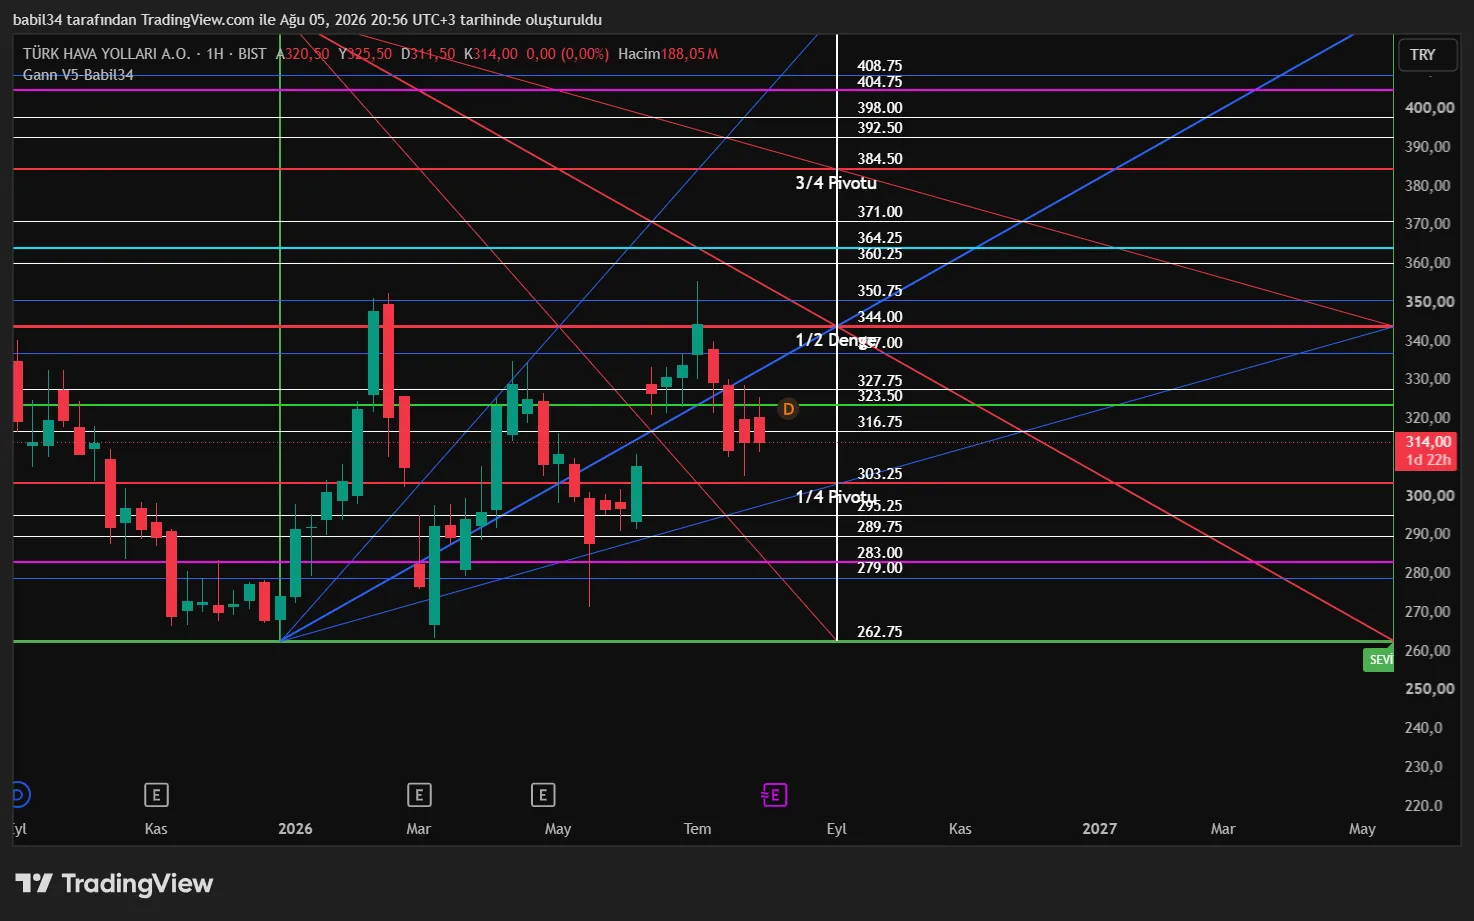
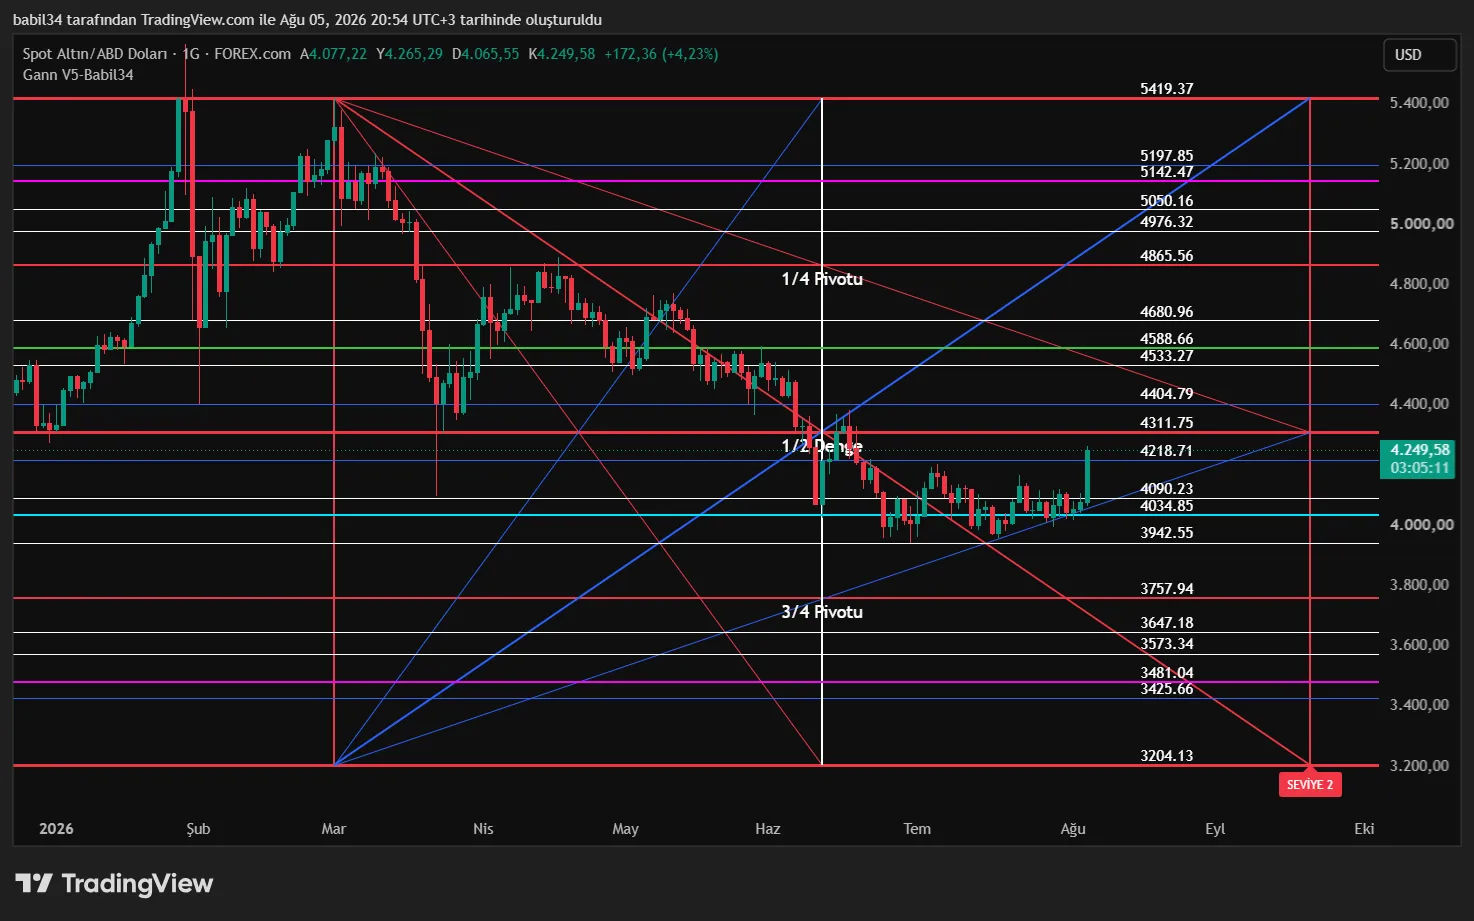
Gann analysis as developed by W. D. Gann: the price-time relationship, Gann angles, fans, the Gann box, time cycles and squaring. All the core topics in one guide.
How are Gann fans and Gann angles drawn on a chart? The basics of analysing the relationship between price and time using the 1x1, 1x2 and 2x1 angles.
What is technical analysis and how do you read a chart? Learn trend, support and resistance, volume, momentum, indicators and risk management in a clear order.
Get in touch for pricing, licence term and setup. Your access is set up once payment is complete.