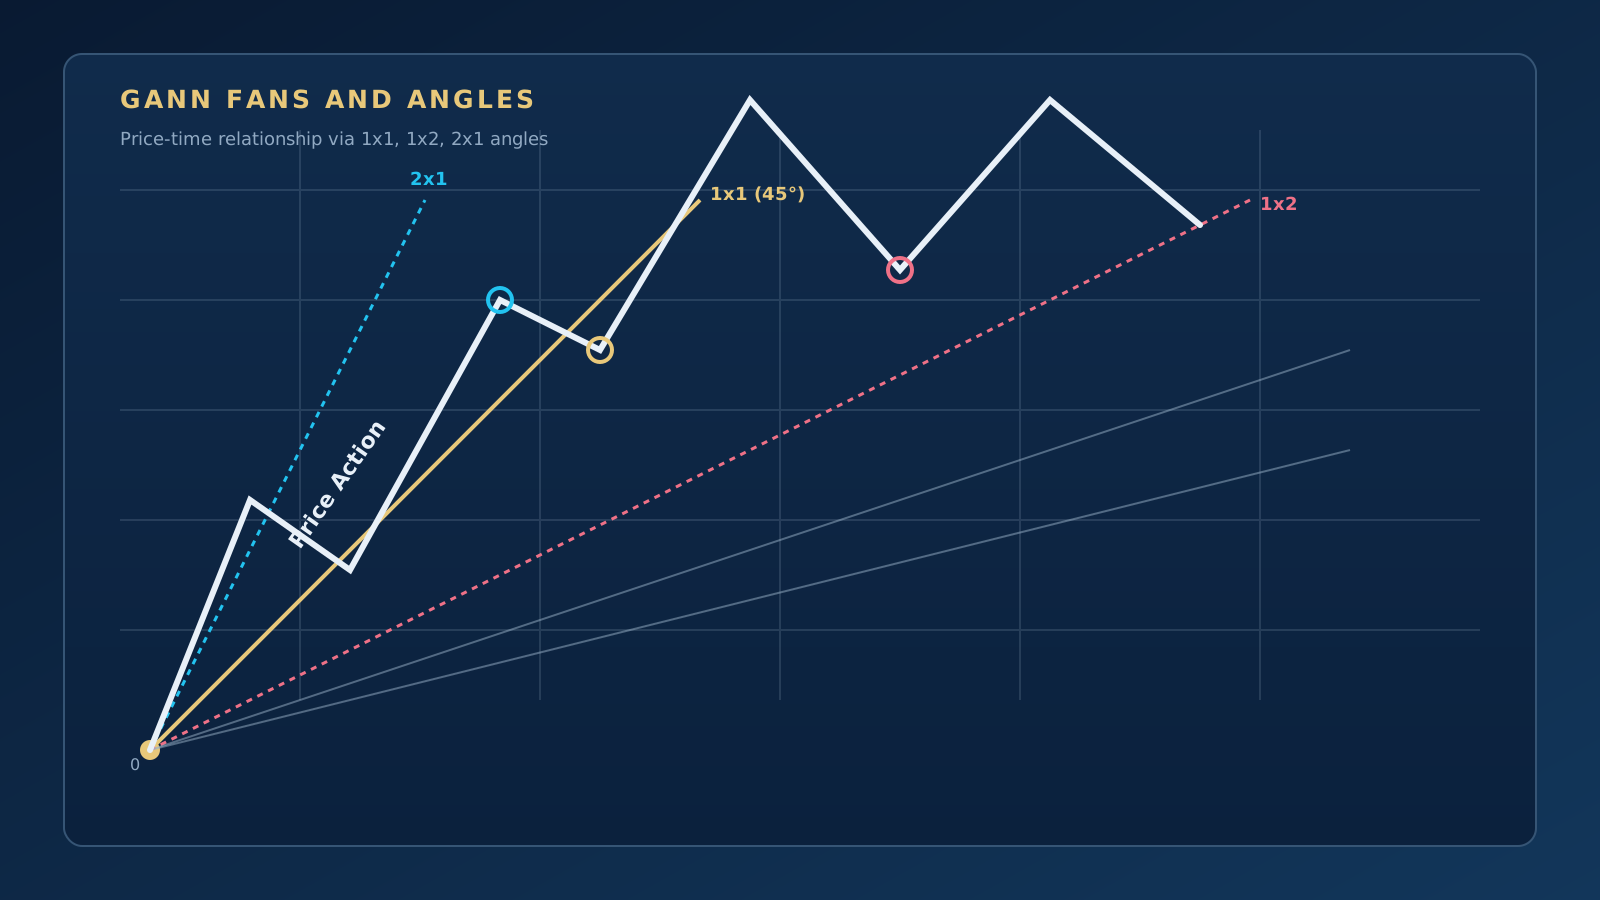
According to W.D. Gann's theory, financial markets do not move randomly; there is a mathematical balance between price and time. Gann fans and angles project that balance onto the chart and help us find the speed and strength of a trend and its future support/resistance points.
What Does the 1x1 Angle (45 Degrees) Mean?
The 1x1 angle sits at the centre of Gann theory. It is the angle at which price changes by 1 unit for every 1 unit of time (for example, 1 day), and it represents perfect balance.
- In a rising market, if price stays above the 1x1 angle, the trend has a bullish bias.
- In a falling market, if price stays below the 1x1 angle, the trend has a bearish bias.
- When price breaks the 1x1 line, it is a sign of a major trend change or a serious correction.
Other Important Gann Angles
Price does not always move at a perfect 45-degree angle. Other angles are used to measure the phases in which the trend accelerates or slows down:
- 2x1 (steep angle): 2 units of price change in 1 unit of time. Indicates a fast, aggressive trend. Price usually cannot stay on this angle for long.
- 1x2 (flat angle): 1 unit of price change in 2 units of time. Indicates that the trend is slowing down and entering a resting phase.
- 1x4, 1x8, 4x1 and so on: Other important support and resistance lines with steeper or flatter slopes.
How to Draw a Gann Fan
To draw a Gann fan, a prominent high (peak) or low is selected. If we are drawing from a low, the fan spreads upwards to measure the angle of the advance. If we are drawing from a high, a downward fan is created.
When drawing by hand, setting the chart's price/time ratio (scale) correctly is vital. Otherwise, 45 degrees does not represent the true 1x1. To overcome this difficulty, the Gann V5-Babil34 indicator calculates these angles automatically and in the correct proportion, based on the market's volatility and ATR values, and plots them on the screen.
More than twenty years of market experience, specialising in Gann analysis. Builds TradingView indicators and MetaTrader 5 automation software, and teaches one-to-one.
About →