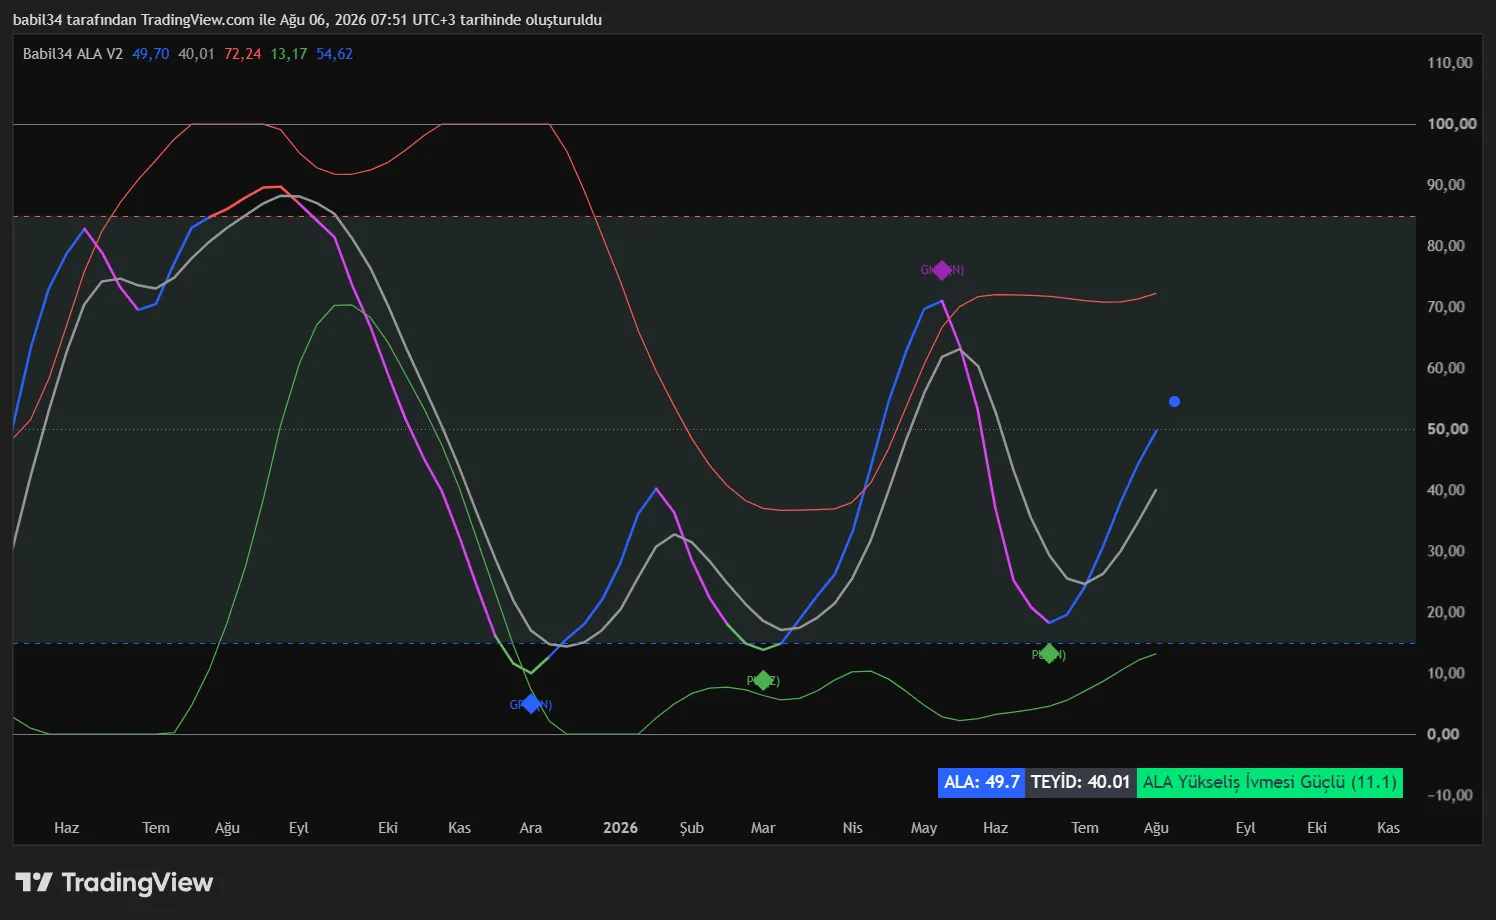
An adaptive oscillator that measures momentum on a 0-100 scale. What sets it apart from classic oscillators: it does not just show the current value, it calculates the value of the next bar.
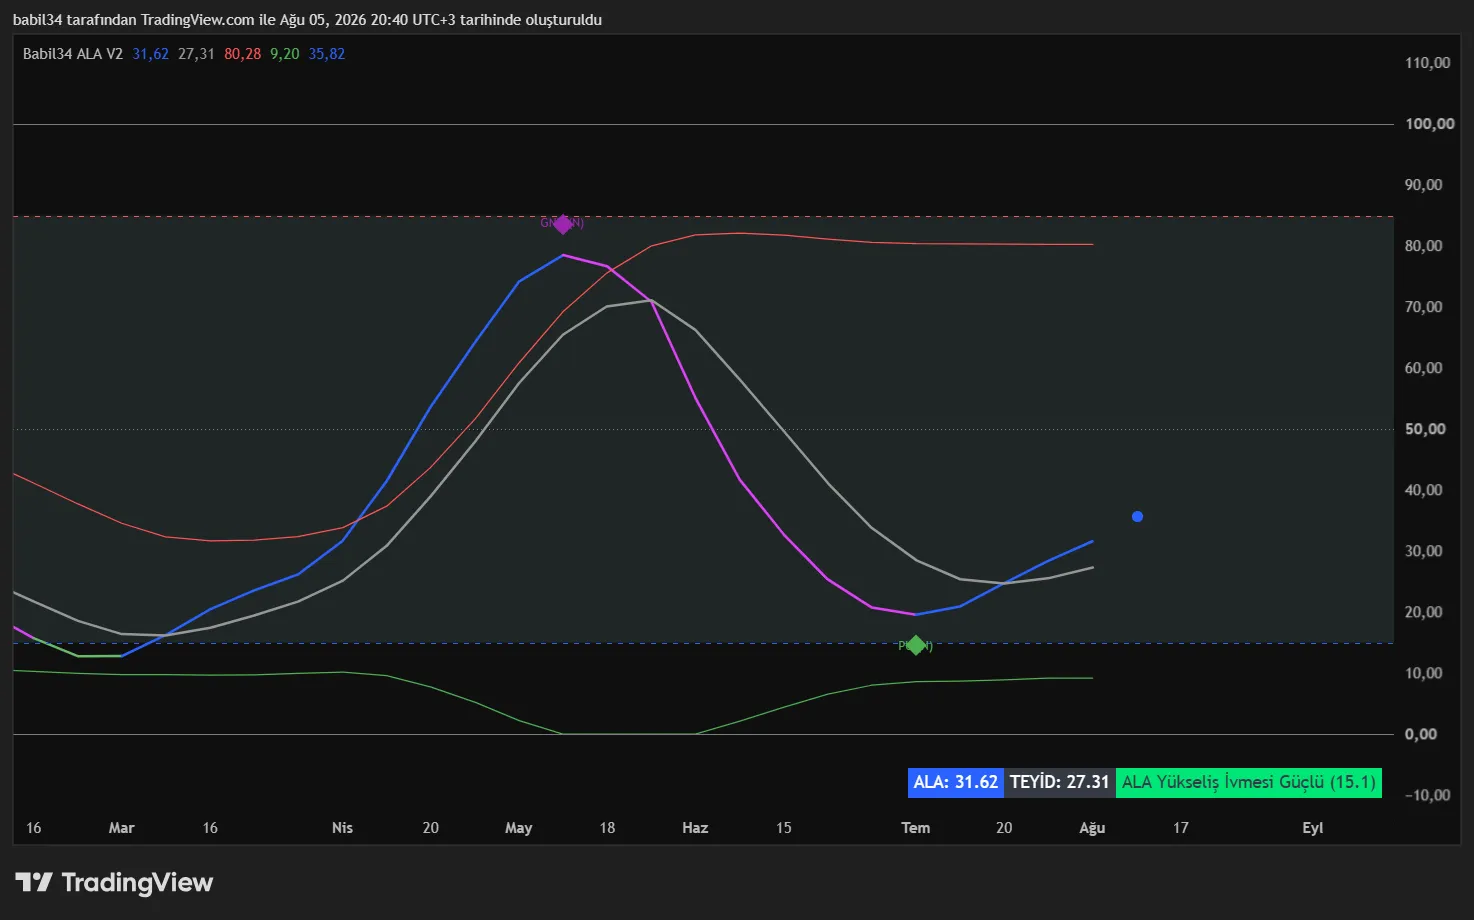
The system's internal variables are carried one step forward to calculate an estimated value for the next bar, plotted as a dot on the chart. You see the turn while it happens, not after.
A setting that works on the 15-minute chart produces noise on the weekly. ALA knows this: it applies separate smoothing coefficients for 15m, 30m, 1h, 4h, daily and weekly automatically. You never touch the settings.
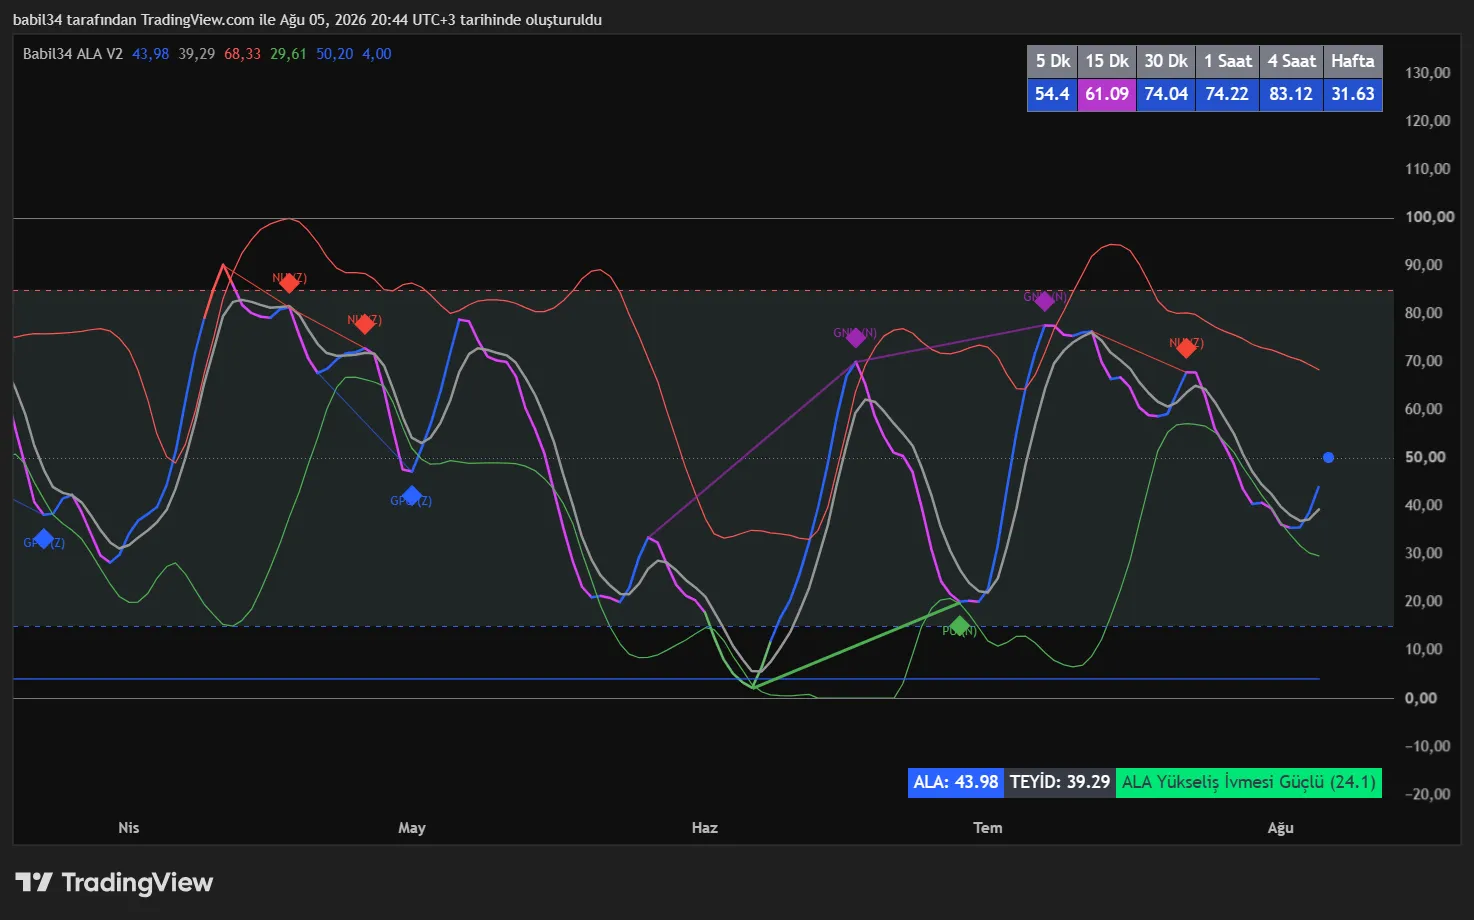
Bullish (PU), Bearish (NU), Hidden Bullish (GPU) and Hidden Negative (GNU). The real difference: by measuring the distance between the two pivots, it labels every divergence Weak (Z) / Normal (N) / Strong (G).
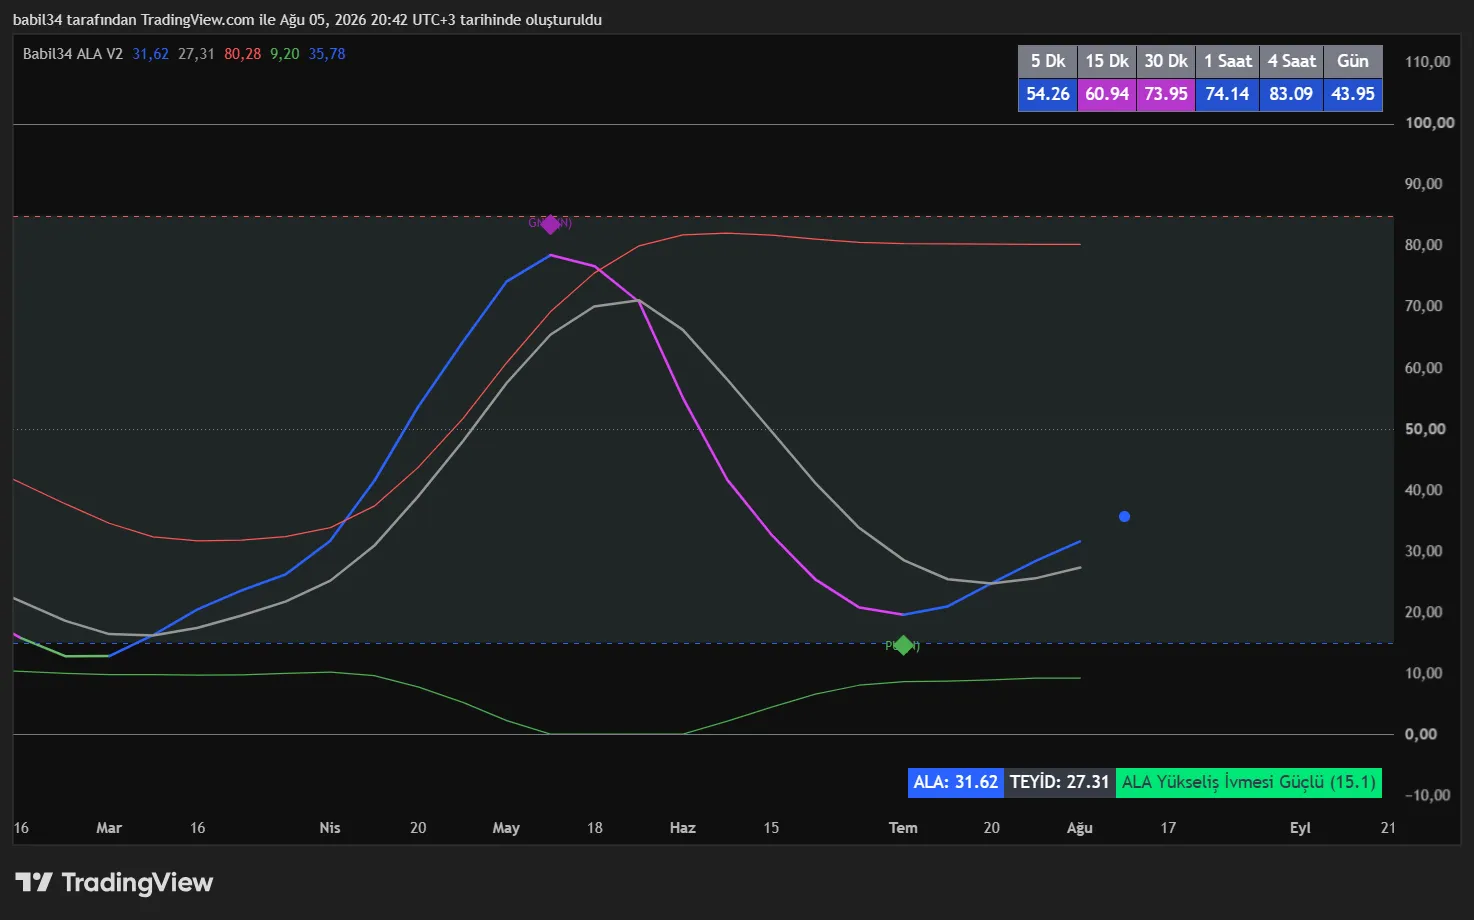
A single line in the corner panel: "ALA Bullish Momentum Strong", "ALA Bearish Momentum Low", "ALA Sideways". The momentum period and threshold also adjust automatically to the timeframe.
5m, 15m, 30m, 1h, 4h, daily and weekly - the ALA value and colour of each in a single table. You see the whole picture without switching charts.
CONFIRM line crossovers, standard-deviation-based dynamic bands, overbought/oversold levels and eight ready-made alerts.
What are bullish and bearish divergence, and how do you spot them on a chart? A guide to regular and hidden divergence and to reading them alongside oscillators.
What is RSI and how do you read the 70 and 30 levels? A guide to overbought and oversold conditions, RSI divergence and momentum analysis within a trend.
What is MACD and how do you read line and signal crossovers? Learn the histogram, zero line, divergence and the limitations of MACD as a lagging indicator.
Get in touch for pricing, licence term and setup. Your access is set up once payment is complete.