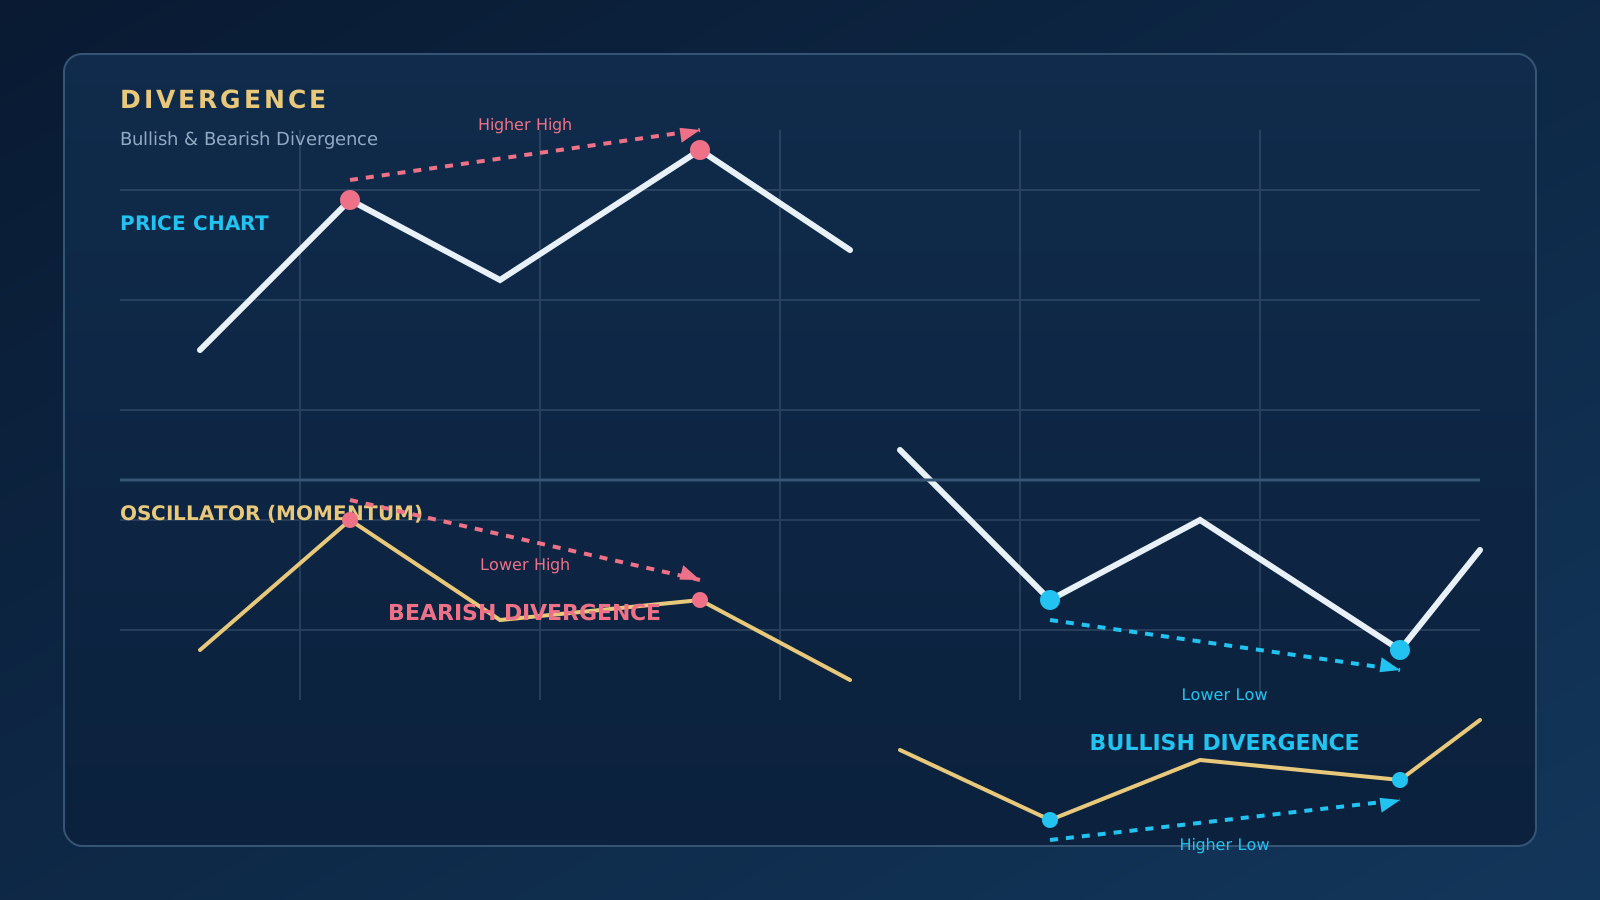
Divergence describes situations in which the movement on the price chart is not supported by the indicator being used (usually the RSI, MACD or an oscillator). It can signal that momentum in the market is weakening and that a potential trend reversal or correction may be ahead.
Bullish Divergence
Seen towards the end of a downtrend. Price makes a lower low while the indicator makes a higher low.
This shows that even though price keeps falling, the strength (momentum) of the sellers is fading and buyers are starting to step in. An upward reversal is a possibility on the table.
Bearish Divergence
Seen at the peaks of an uptrend. Price makes a higher high while the indicator makes a lower high.
It signals that buying momentum is slowing and that the advance can no longer find enough buyers. A downward correction or trend reversal may follow.
Hidden Divergence
While regular divergence signals a trend reversal, hidden divergence suggests that the trend will continue.
- Hidden bullish divergence: Price makes a higher low while the indicator makes a lower low (continuation of the uptrend).
- Hidden bearish divergence: Price makes a lower high while the indicator makes a higher high (continuation of the downtrend).
Using Divergence with Oscillators
Divergence is not a "buy" or "sell" signal on its own. Price can keep moving in the same direction despite the divergence. Before entering a trade, confirmation from support/resistance zones or price action is needed.

More than twenty years of market experience, specialising in Gann analysis. Builds TradingView indicators and MetaTrader 5 automation software, and teaches one-to-one.
About →