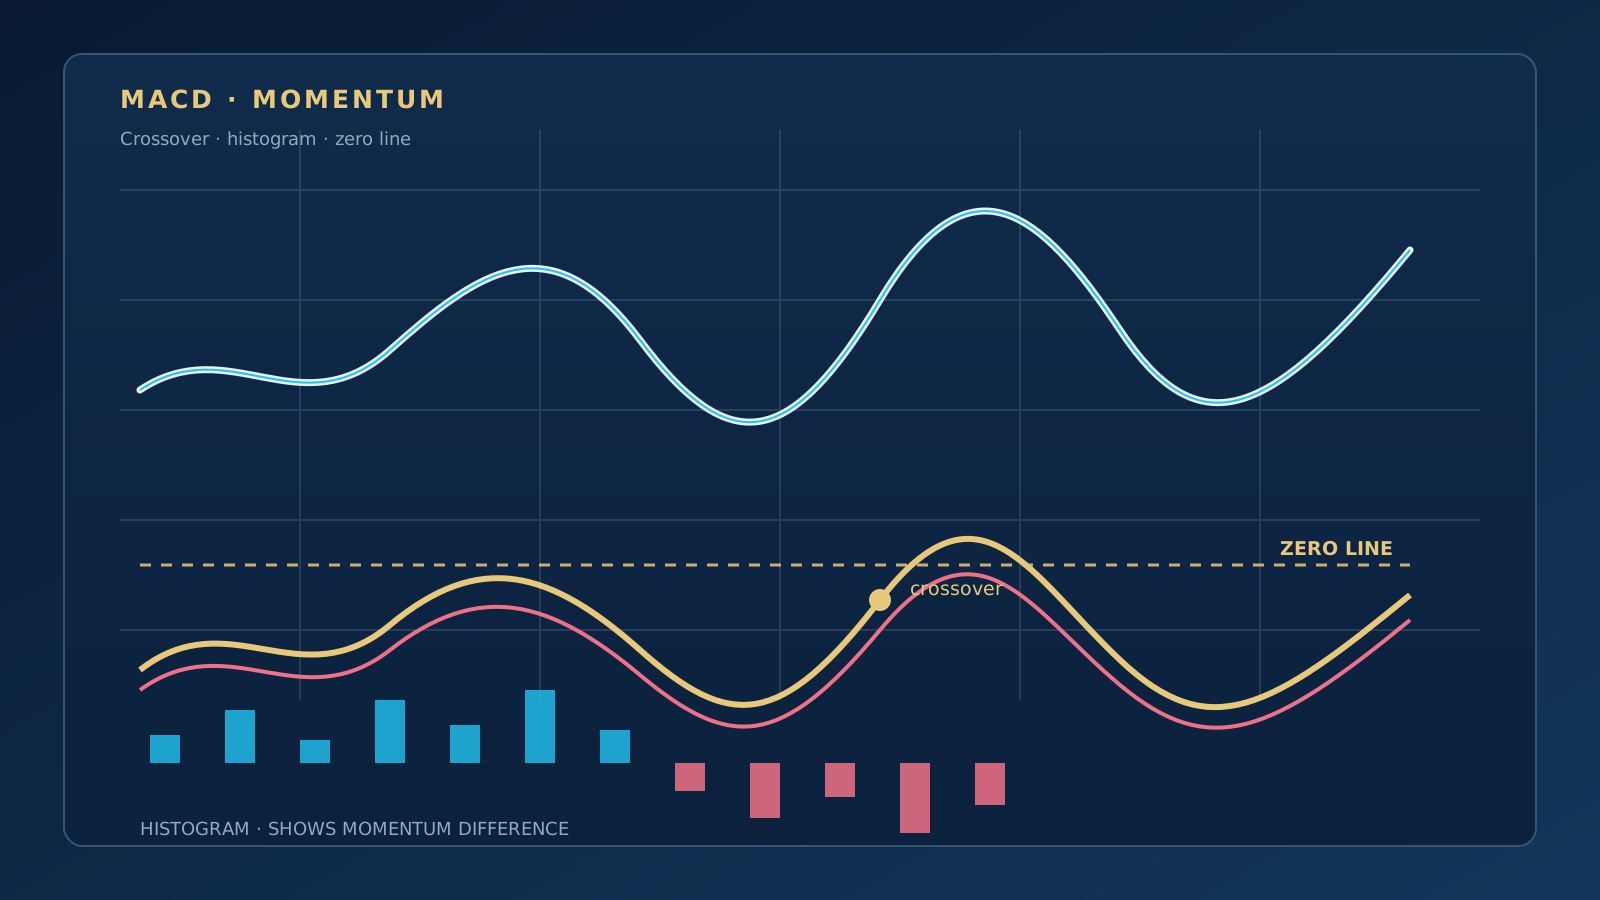
MACD (Moving Average Convergence Divergence) is an indicator that uses the relationship between two exponential moving averages to give an idea of trend direction and changes in momentum. It consists of three main parts: the MACD line, the signal line and the histogram.
Because MACD is calculated from past prices, it is a lagging indicator. A crossover or a change in the histogram does not say with certainty where price will go next. The most productive use is to evaluate scenarios together with trend, support and resistance, volume and the candle close.
How Is MACD Calculated?
The classic MACD setting uses periods of 12, 26 and 9. The simplified structure is as follows:
- MACD line: The 26-period exponential moving average is subtracted from the 12-period exponential moving average.
- Signal line: The 9-period exponential moving average of the MACD line.
- Histogram: Shows the difference between the MACD line and the signal line.
When the periods are changed, the indicator responds faster or slower. A faster setting can produce earlier but noisier signals, while a slower setting can produce later but calmer movement.
MACD and Signal Line Crossover
When the MACD line crosses above the signal line, the possibility of bullish momentum is watched; when it crosses below, the possibility of bearish momentum. These crossovers can flip frequently, especially in sideways markets, and can produce false signals.
- Bullish crossover: Examined as a scenario in which momentum is starting to strengthen.
- Bearish crossover: Examined as a scenario in which momentum is weakening.
The level at which the crossover occurs matters. A bullish crossover above the zero line and a bullish crossover below the zero line do not describe the same market context.
What Does the Zero Line Mean?
MACD being above zero means the shorter average is higher than the longer average, and being below zero means it is lower. For this reason the zero line can be used as a supporting reference for reading the trend context.
Crossing the zero line does not prove a trend change on its own. The trend structure of price and its behaviour at important levels should be checked separately.
How Is the MACD Histogram Read?
The histogram shows the distance between the two lines. If the bars are growing, the gap between the two lines is widening; if they are shrinking, the gap is narrowing. This can offer a visual clue as to whether momentum is strengthening or weakening.
- A growing histogram above zero can indicate that the bullish gap is widening.
- A shrinking histogram above zero may suggest that bullish momentum is slowing.
- A growing histogram below zero can indicate that the bearish gap is widening.
- A histogram approaching zero tells you the gap between the two averages is closing.
A shrinking histogram does not mean price will necessarily reverse. In strong trends the momentum gap can narrow temporarily while price keeps moving in the same direction.
What Is MACD Divergence?
When price makes a new high while MACD forms a lower high, bearish divergence is investigated; when price makes a new low while MACD forms a higher low, bullish divergence is investigated.
Divergence can indicate that momentum is not following price with the same strength, but it does not say when a reversal will happen. Price can keep moving against the direction of the divergence for a long time. For this reason divergence can be compared with other momentum observations such as RSI divergence, but it should not be used as the sole reason for a trade.
Which Markets Is MACD Used In?
MACD can be used on stock, crypto, forex, commodity and index charts. However, each market has its own volatility, trading hours and data quality. The same periods should not be expected to give the same result on every symbol.
- Higher timeframes are used to examine broader trends.
- Lower timeframes produce earlier but noisier crossovers.
- News hours and low-liquidity periods can make the indicator harder to interpret.
Using MACD with Support, Resistance and Volume
Instead of treating a MACD crossover directly as a trade signal, check what price is doing at an important zone. If a support or resistance breakout happens in the same direction as MACD, the scenario may be more noteworthy. A rise in volume can also provide additional information about participation in the breakout.
These indicators pointing in the same direction does not guarantee the outcome. The invalidation point, position size and loss limit should be set in advance, independently of the indicators.
Limitations of MACD
- It lags: It produces a crossover after the move has begun; it does not announce a reversal in advance.
- It struggles in sideways markets: Frequent crossovers can produce indecisive and false signals.
- It is parameter-sensitive: Different settings can give different results on the same chart.
- It does not replace price: Levels, trend, news and trading costs must be taken into account.
Beginner Mistakes
- Treating every MACD crossover as an automatic buy or sell signal.
- Ignoring the zero line and the higher timeframe.
- Expecting an immediate trend reversal as soon as the histogram shrinks.
- Interpreting divergence as a certain reversal.
- Constantly changing the periods without testing them on past data.
Quick Summary
MACD is a useful but lagging indicator that examines trend direction and the momentum gap. Crossovers, the zero line and the histogram should be read together, and signals should be confirmed with support and resistance, trend, volume and a risk plan.
To compare momentum indicators side by side, continue with What Is RSI?, and for the basics of chart reading, see the What Is Technical Analysis? guide.

More than twenty years of market experience, specialising in Gann analysis. Builds TradingView indicators and MetaTrader 5 automation software, and teaches one-to-one.
About →