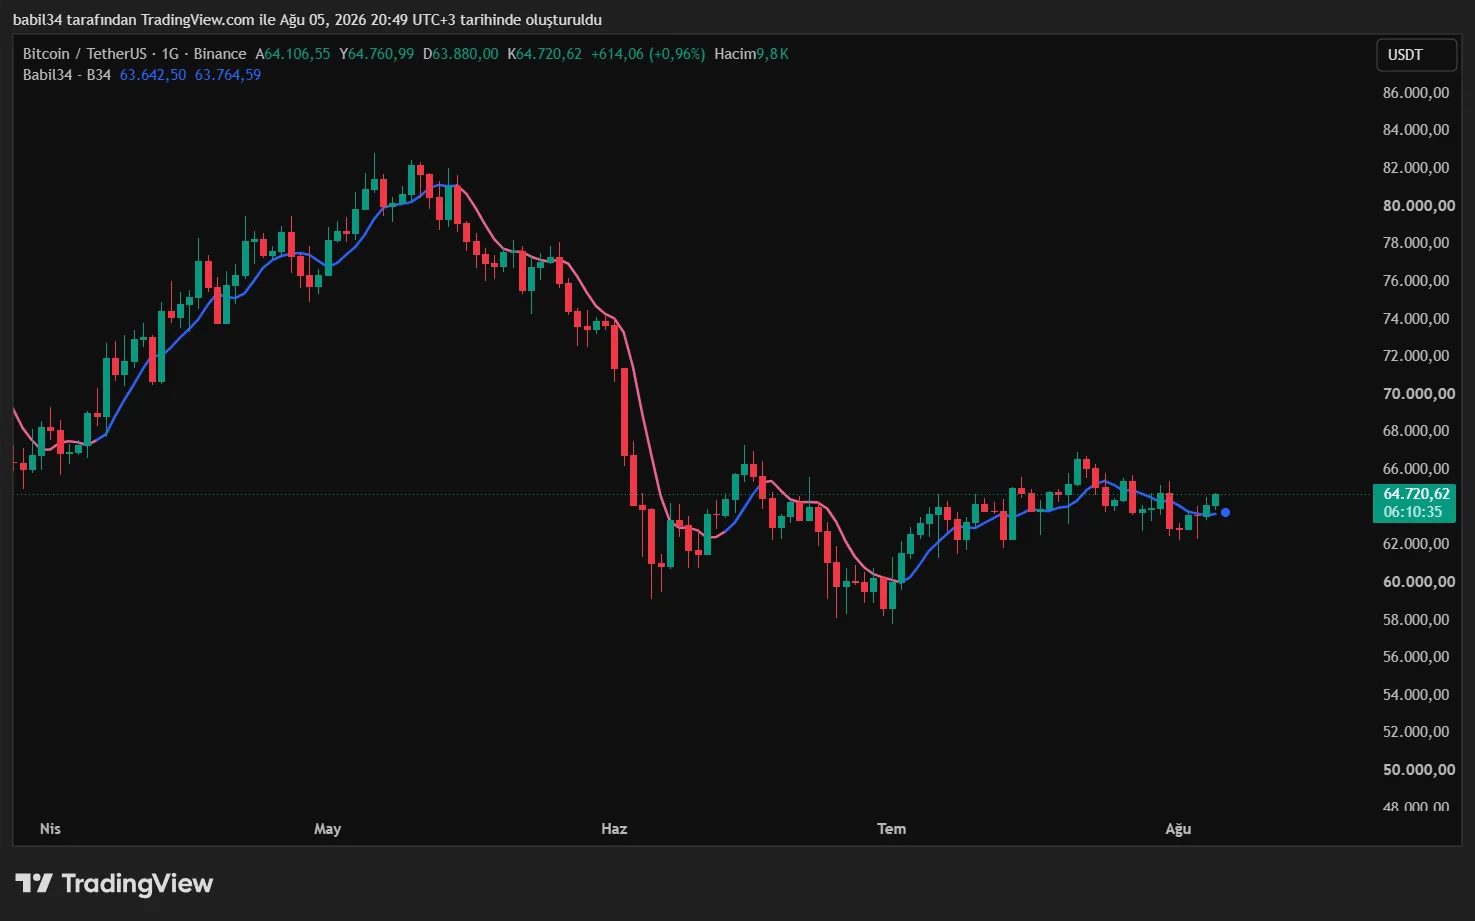
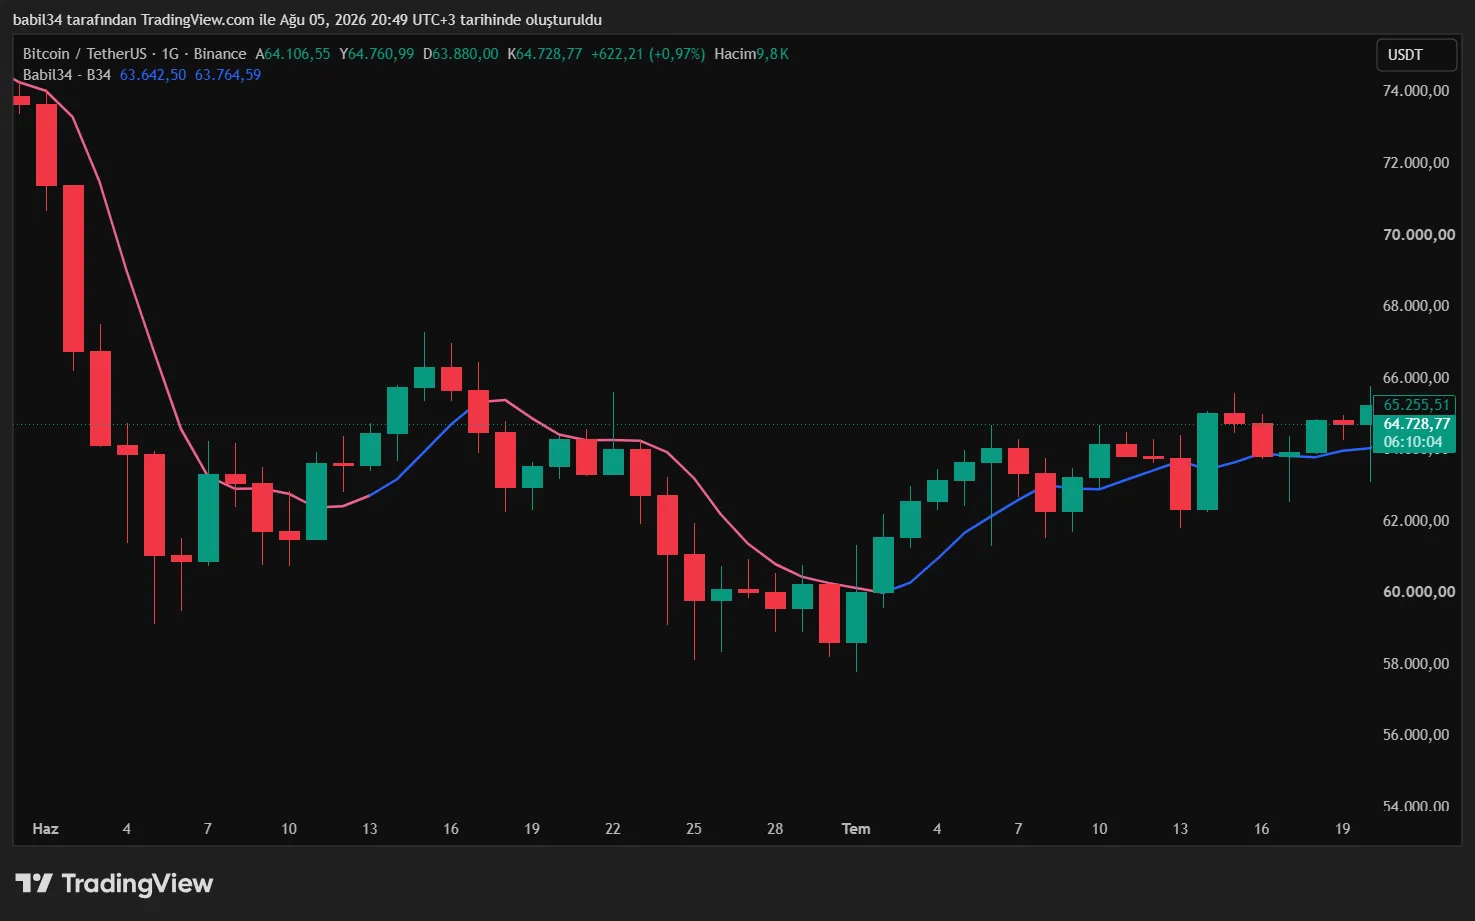
A trend line shaped by the centre of gravity of Gann ratios. Two states, blue and pink, and a single setting - my simplest product and the quickest to learn.
ATR-based upper and lower bands are calculated but never drawn - they are used only for the colour decision. Until price breaks through this invisible wall, the colour of the line does not change. That is what keeps signal noise down in sideways markets.
It is not a plain moving average. Candidate levels are generated from the Gann ratio pool (0, 1/8, 1/6, 1/4, 0.458, 0.542...) and each is weighted by its distance from price. The line takes its shape from the pull of those levels.
Like the other products, B34 also calculates an estimated value for the next bar and plots it as a dot to the right of the chart.
The ATR multiplier changes with the symbol: wider for crypto, medium for stocks and indices, narrow for forex. It does not treat Bitcoin's volatility the same as EUR/USD's.
Apart from the band filter coefficient there is nothing to fiddle with. If you get too many signals in a range, you raise the coefficient - that is all.
Anyone who does not want to deal with cluttered screens and wants to see the trend direction clearly. It also works well as an entry point into the Babil34 products.
What is a trend line and how do you identify uptrends and downtrends? A chart-reading guide covering touches, breakouts, retests and multiple timeframes.
What are support and resistance and how do you find them on a chart? Learn price zones, breakouts, retests, volume confirmation and common beginner mistakes.
What is technical analysis and how do you read a chart? Learn trend, support and resistance, volume, momentum, indicators and risk management in a clear order.
Get in touch for pricing, licence term and setup. Your access is set up once payment is complete.