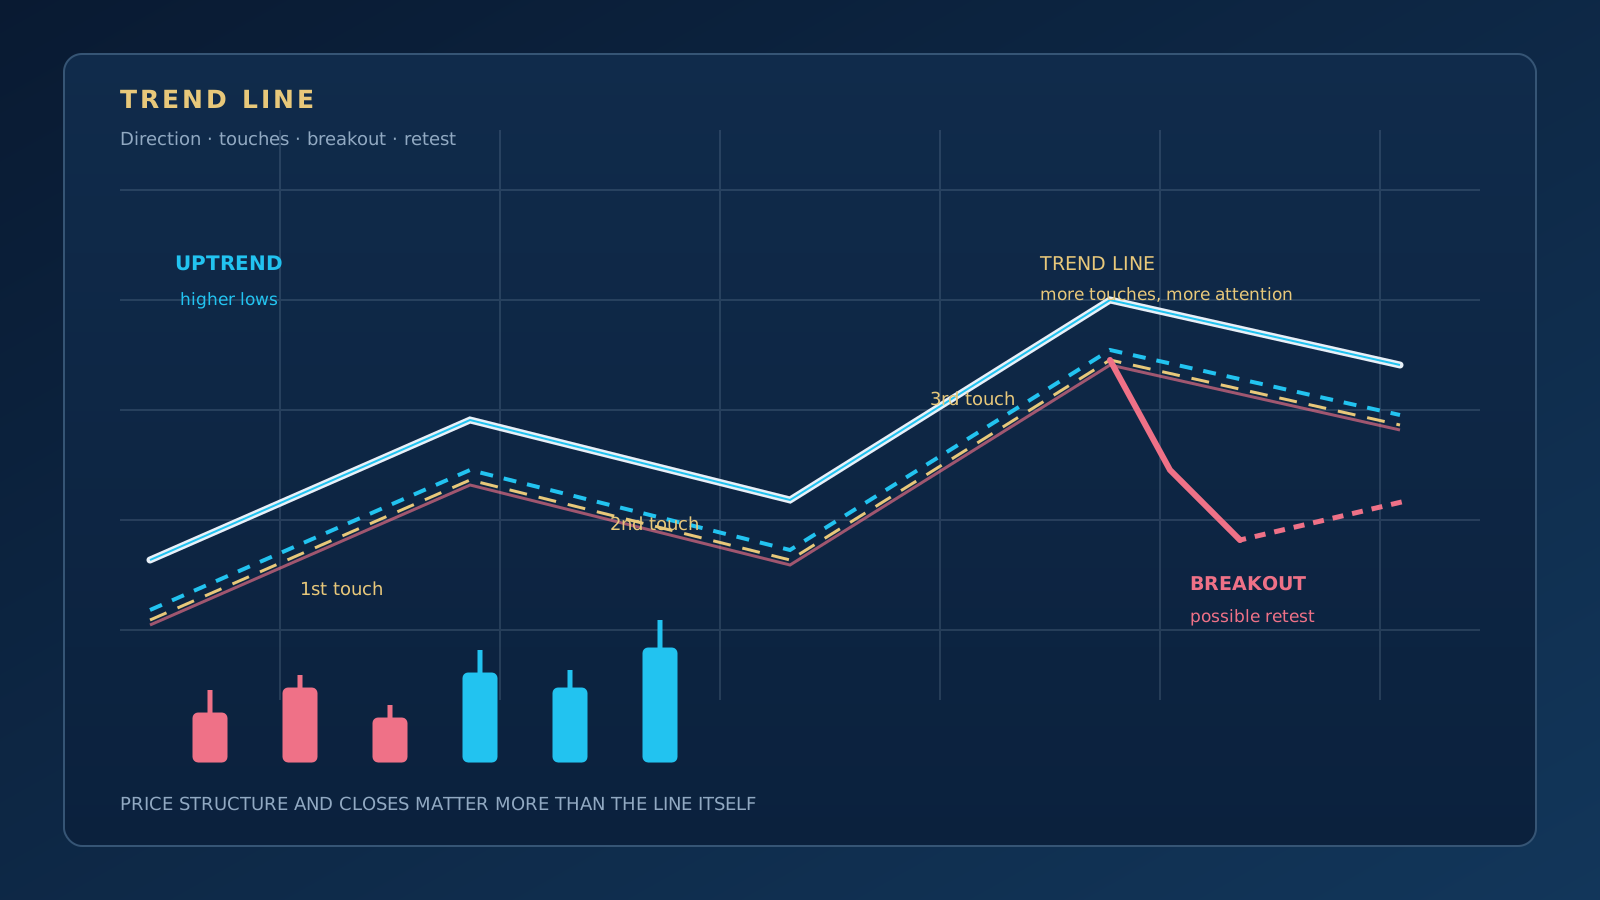
A trend line is used to visualise the direction price has followed over a period of time and the significant lows or highs within that direction. In an uptrend the lows are connected; in a downtrend the highs are connected. In a sideways market, price mostly moves within a band and no clear slope forms.
A trend line is not a boundary that guarantees the future. When market conditions change, the line can break, price can step outside it briefly, or the line may have been drawn incorrectly from the start because of a poor choice of pivots.
What Is an Uptrend?
In an uptrend, price generally forms higher lows and higher highs. Buyers stepping in above the previous low on each pullback suggests the bullish structure is being maintained.
The line is drawn beneath the rising lows. As price approaches the line it may react as if at support; however, it should not be assumed that every touch will end in a bounce.
What Is a Downtrend?
A downtrend shows lower highs and lower lows. Sellers meeting each rally below the previous high can indicate that pressure in the market is continuing.
The line is drawn above the clear swing highs of the decline. When price reaches the line it may act as resistance; but a strong close and rising participation can also show that the line is about to be overcome.
How to Draw a Trend Line
- Decide which market and timeframe you are studying.
- Select clear, well-separated lows or highs on the chart.
- Connect the lows in a rising structure and the highs in a falling structure.
- Do not force the line to fit the price, and do not anchor it to every small wick.
- Check in past data whether the line behaved in a similar way across different periods.
Two points make a line; a third touch provides a more meaningful observation that the market is noticing the line. This does not mean the line is definitely valid. The quality of the touches and the price structure between them should also be examined.
Wick or Close?
Wicks show short-lived overshoots, while closes show where the balance between buyers and sellers settled at the end of the period. Touching the line with wicks only and having candles close on the same side of the line do not convey the same information.
- Wick: Suggests a quick rejection or a liquidity grab; on its own it is not a breakout.
- Close: Helps assess whether price is holding beyond the line.
- Consecutive closes: A continuing structure rather than a single candle can make the scenario more meaningful.
How to Read a Trend Line Break
When price moves beyond the trend line, the possibility of a breakout arises. To evaluate it, look at the candle close, the volume behind the move, the timeframe on which the break occurred and the trend on the higher timeframe, all together.
A slight overshoot of the line does not always mean the trend is over. A low-volume wick, a quick reversal or a close back inside the line can raise the likelihood of a false breakout.
What Is a Retest?
A retest is the re-examination of a broken trend line or price zone after the break. A rising trend line broken to the downside may be tested as resistance; a falling trend line broken to the upside may be tested as support.
A retest does not occur on every breakout. When it does, it should be treated as additional information for evaluating the breakout scenario rather than as a trade signal.
Trends on Different Timeframes
An asset can show different trends on different timeframes at the same time. The daily chart may show a rising structure while the hourly chart is in a pullback. This is why the timeframe a line belongs to must always be stated.
- The higher timeframe is used for the overall direction and the main zones.
- The lower timeframe can refine the entry scenario and the short-term structure.
- A break on the lower chart may be nothing more than a normal pullback on the higher chart.
Trend Lines and Support and Resistance
Trend lines are sloped, while support and resistance zones are mostly horizontal measurements. When the two intersect in the same price area, a more noteworthy zone to watch can form. This does not mean a certain reversal; it means that different observations are pointing to the same area.
The support and resistance article explains how price zones are identified, and the Gann Analysis article looks at the relationship between price and time.
Common Beginner Mistakes
- Treating every point as a pivot: Too many touches make the line meaningless.
- Fitting the line after the fact: A line that looks good in hindsight may not hold going forward.
- Relying on a single timeframe: Without checking the larger structure, small breaks can be misread.
- Acting immediately on a break: The scenario is not complete until the close and retest behaviour have been seen.
- Having no risk plan: Know in advance where the idea becomes invalid if the line fails.
Quick Summary
A trend line helps you read market direction and how price behaves around a particular slope. It is best used by choosing clear pivots, stating the timeframe explicitly, testing breaks with the close and volume, and never treating the line as a signal on its own.
To build the foundations of technical analysis, continue with What Is Technical Analysis?, and to study horizontal price zones, read What Are Support and Resistance?.

More than twenty years of market experience, specialising in Gann analysis. Builds TradingView indicators and MetaTrader 5 automation software, and teaches one-to-one.
About →