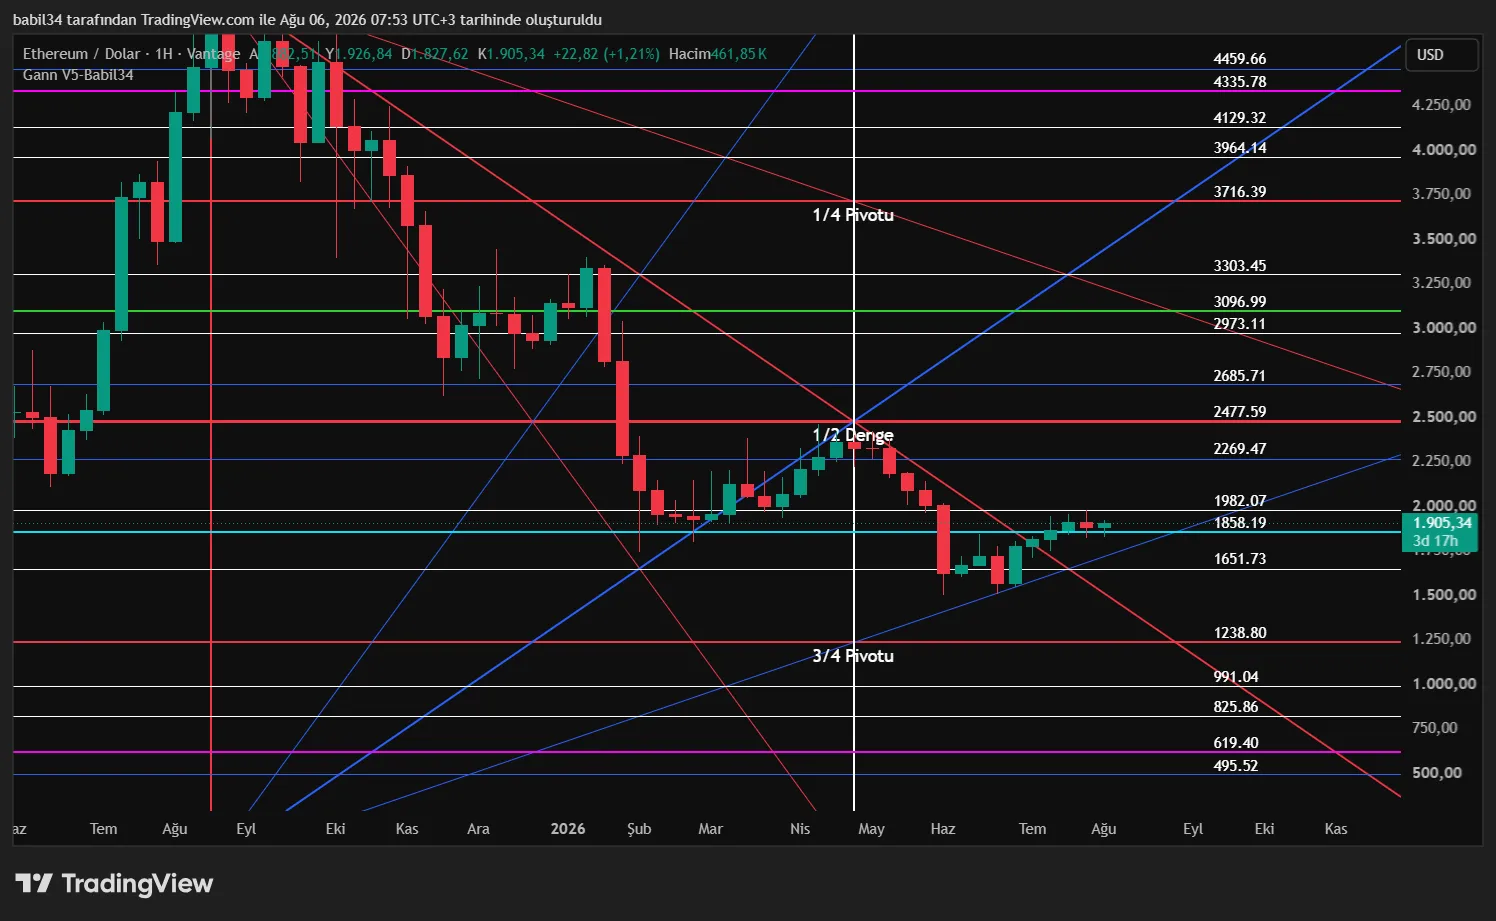
Gann analysis is a technical analysis approach that tries to read price movement not as a single line but as a structure formed jointly by price and time. Three questions sit at its centre: At what level did the move start, how long did it take to unfold, and do the same proportions repeat at another scale?
This article treats the Gann method not as a prophecy or a system of certain signals, but as an analytical framework used to test the relationships between level, slope and time on a chart. We will first explain the basic concepts and then show how they can be read together in practice.
What Is Gann Analysis?
Gann analysis is a framework that starts from prominent lows and highs and examines the proportions by which price advances, how time accompanies that move, and where possible reaction zones may form. Geometric drawings are not signals on their own here. For a meaningful reading, the chosen pivot, the scale used and the observed market context must be stated clearly.
- Price-time balance: When the same price move takes place over different periods of time, the character of the market changes. That is why the elapsed time is tracked as closely as the price level.
- Ratio and scale: Ratios such as 1x1, 1x2 or 2x1 describe the speed of price relative to time. Their visual angle on the chart depends on the data scale; they do not automatically represent the same 45 degrees on every chart.
- Testability: A line or a cycle only becomes a useful hypothesis when it has been tested repeatedly on historical data and across different periods. No ratio guarantees a reversal on its own.
Who Was W. D. Gann?
William Delbert Gann (1878-1955) was an American trader and author who studied the relationship between price and time through geometric proportions. The ideas known today as "Gann theory" gather around angle drawings, squaring, time cycles and the combined evaluation of significant dates.
- The question of sources: There are many popular accounts of Gann's successes and methods. Specific trading records and travel stories in particular are reported differently in different sources, so they should not be read as a verified guarantee of performance.
- His real legacy: What stands out in Gann's books is the idea of measuring the price chart, comparing time intervals and tracking recurring proportions. Modern applications speed these ideas up with software; they do not remove the part of the method that requires interpretation.
- Major works: How to Make Profits in Commodities, Truth of the Stock Tape and his symbolic novel Tunnel Thru the Air, in which he presented forward-looking market forecasts through a fictional story, are among his best-known works.
The Price-Time Relationship
In the Gann approach, price and time are not separate measures. A 100-point advance after a low says little on its own; whether that advance took 10 days or 100 days changes the speed and the context of the move.
- Balance: Price alone carries no meaning. For a stock or a commodity to form a low or a high, it is not enough to reach a certain price level; time must also mature enough to confirm that price.
- Speed: If price covers a large distance in a short time, the slope of the move steepens; this can point to strong momentum just as much as to an unsustainable pace. The conclusion should be confirmed with other data.
- Intersection: When a price level and an expected time window meet in the same area, that area becomes something to watch. Rather than calling it a "certain reversal", it should be treated as a scenario to be tested with volume, structure and closing behaviour.
Gann Angles and the 1x1 Angle
Also known as Gann trend lines, Gann angles describe specific geometric slopes on the price-time plane. When the chart scale is set correctly, these angles act as support and resistance lines.
The 1x1 ratio describes, under ideal conditions, one unit of price change for one unit of time. The "45 degrees" mentioned here is not a mathematical constant but the visual equivalent on a chart whose price and time axes are scaled appropriately.
- If price holds above the 1x1 ratio, the assumption that the pace of the advance is being maintained is tested.
- If price drops below the 1x1 ratio, the scenario in which the move is losing speed or shifting to a lower ratio is monitored.
The other principal angle degrees:
- 1x8 (82.5°) and 1x4 (75°): Extremely steep, very fast bull trends.
- 1x2 (63.75°): A strong uptrend.
- 2x1 (26.25°): Flatter, weaker trends in which time moves faster than price.
- 4x1 (15°) and 8x1 (7.5°): Deep bear market levels.
The Gann Fan
A Gann fan is the combined display of different price-time ratios radiating from a selected low or high. Whether a fan is useful is measured not by how neatly the lines fit the chart, but by how consistent the results remain when the chosen pivot and the scale change.
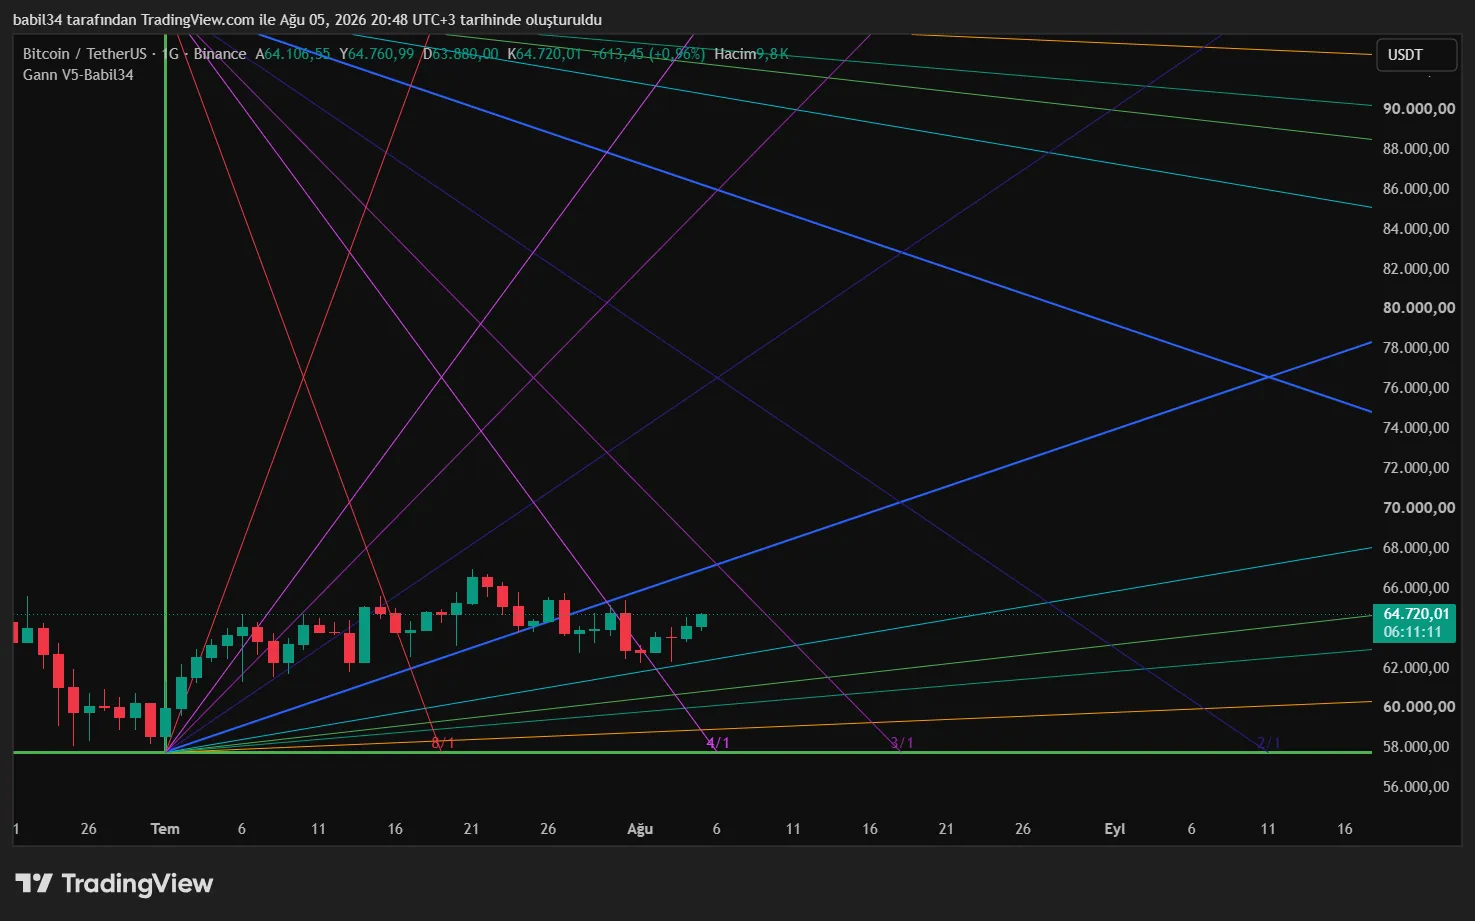
- How it is used: A main low is identified and the central 45° (1x1) line of the fan is fitted onto the chart.
- Dynamic support and resistance: Each ray of the fan serves as a dynamic support or resistance level as price advances.
- Moving between angles: When one ratio breaks, a lower or higher ratio can be watched next; however, it should not be assumed that price will necessarily travel to the next line. The close, volatility and market structure must confirm that scenario.
The Gann Box and Level Calculation
The Gann box compares a selected price range and a selected time span within the same working area. The aim is not to know the future with certainty, but to follow possible support, resistance and timing zones within one frame.
- The squaring mechanism: The price difference between a prominent high and low in the market, and the time that passed between those two points, are turned into a box.
The box is then divided internally by specific mathematical ratios. The most common are:
- 50% (1/2): The most critical balance point in the market.
- Eighths: 1/8 (12.5%), 2/8 (25%), 3/8 (37.5%), 4/8 (50%), 5/8 (62.5%), 6/8 (75%), 7/8 (87.5%).
- Thirds: 1/3 (33.3%) and 2/3 (66.6%).
Time Cycles
Time cycle work is based on measuring the intervals between past lows and highs and watching for similar time windows in the future. The fact that a cycle worked in the past does not mean the same move will repeat on the same date; for that reason, a cycle is less a signal than a calendar area of attention.
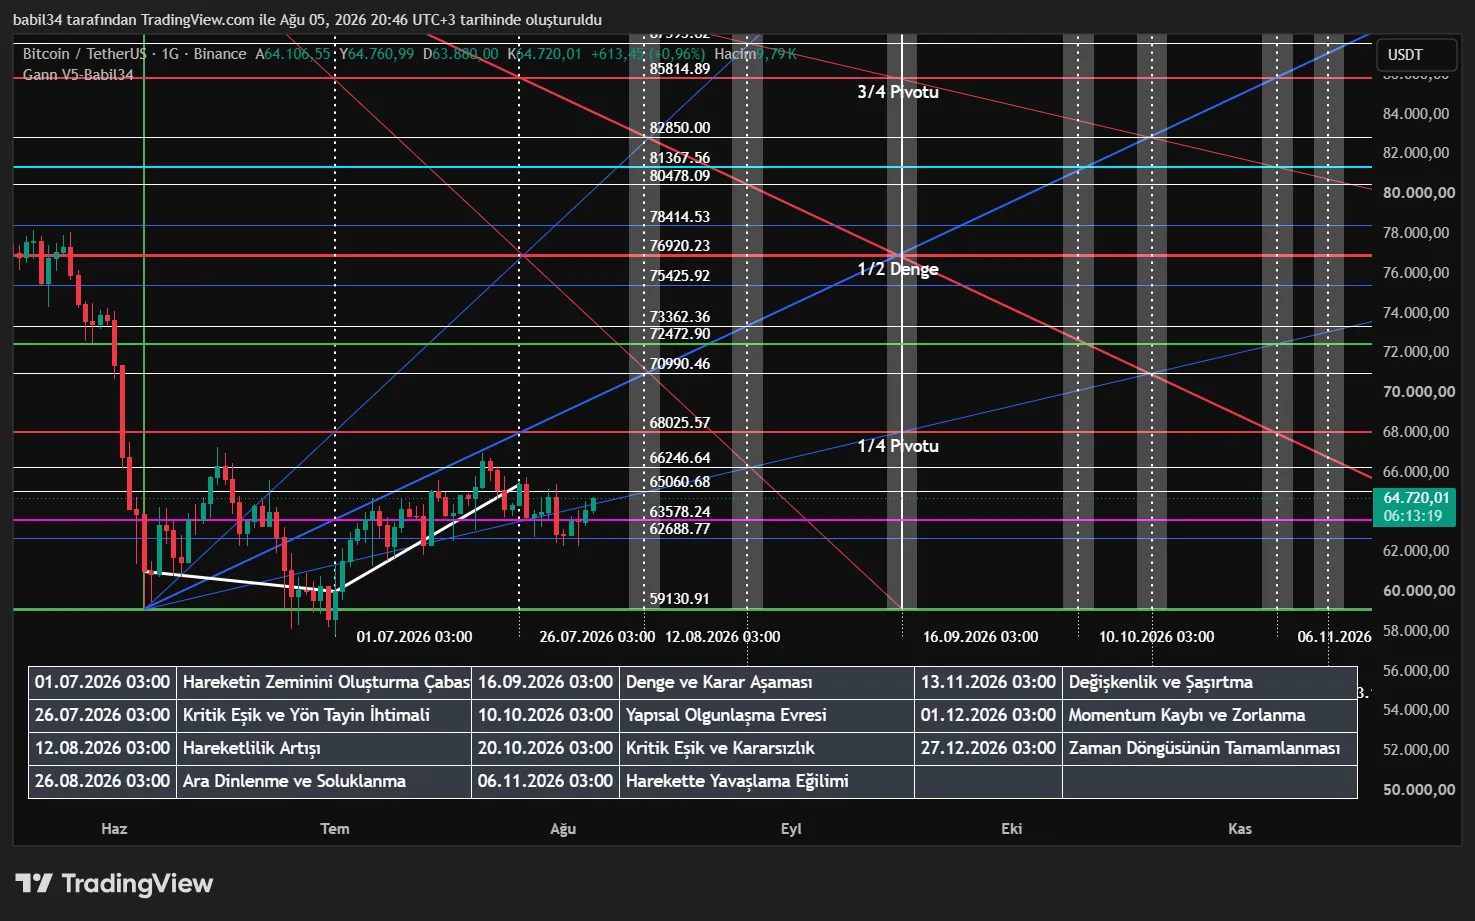
Major time cycles:
- The 60-year cycle: A reference interval used in long-term historical comparisons; its reliability must be tested separately for each market and data set.
- The 30-year cycle: Another time scale used to compare past moves on long-term charts.
- The 20-year and 10-year cycles: Intermediate references that can be tested with a shorter historical sample.
Minor cycles: Specific mathematical periods such as 7 days, 30 days, 49 days (7×7), 90 days and 144 days, which are frequently followed on daily and weekly charts.
Squaring of Time
Squaring of time describes situations in which the price move and the elapsed time match at a specific ratio. Rather than producing a "mysterious" result, it is the idea of comparing two different measures within the same frame.
- The logic: The idea is that price and time convert into one another. For example, if a stock has risen 100 points after reaching a low, time is squared when 100 days or 100 weeks have passed since that low.
- Squaring the range: The passing of as much time as the difference between two past levels.
- Squaring the high or low: Counting as many days or weeks as the numerical value of the highest price level.
When a zone forms in which price and time have advanced at the same ratio, that zone is treated as an area to watch. A sudden or sharp change of direction is not guaranteed; separate confirmation from price structure, volume and the risk plan is required.
Seasonal References and Astronomical Cycles
Seasonal turning points and astronomical references also appear in the Gann literature. Today these are auxiliary calendar markers that must be used with care. A date coinciding with a few reversals in the past does not, on its own, prove causation or a result that will repeat in the future.
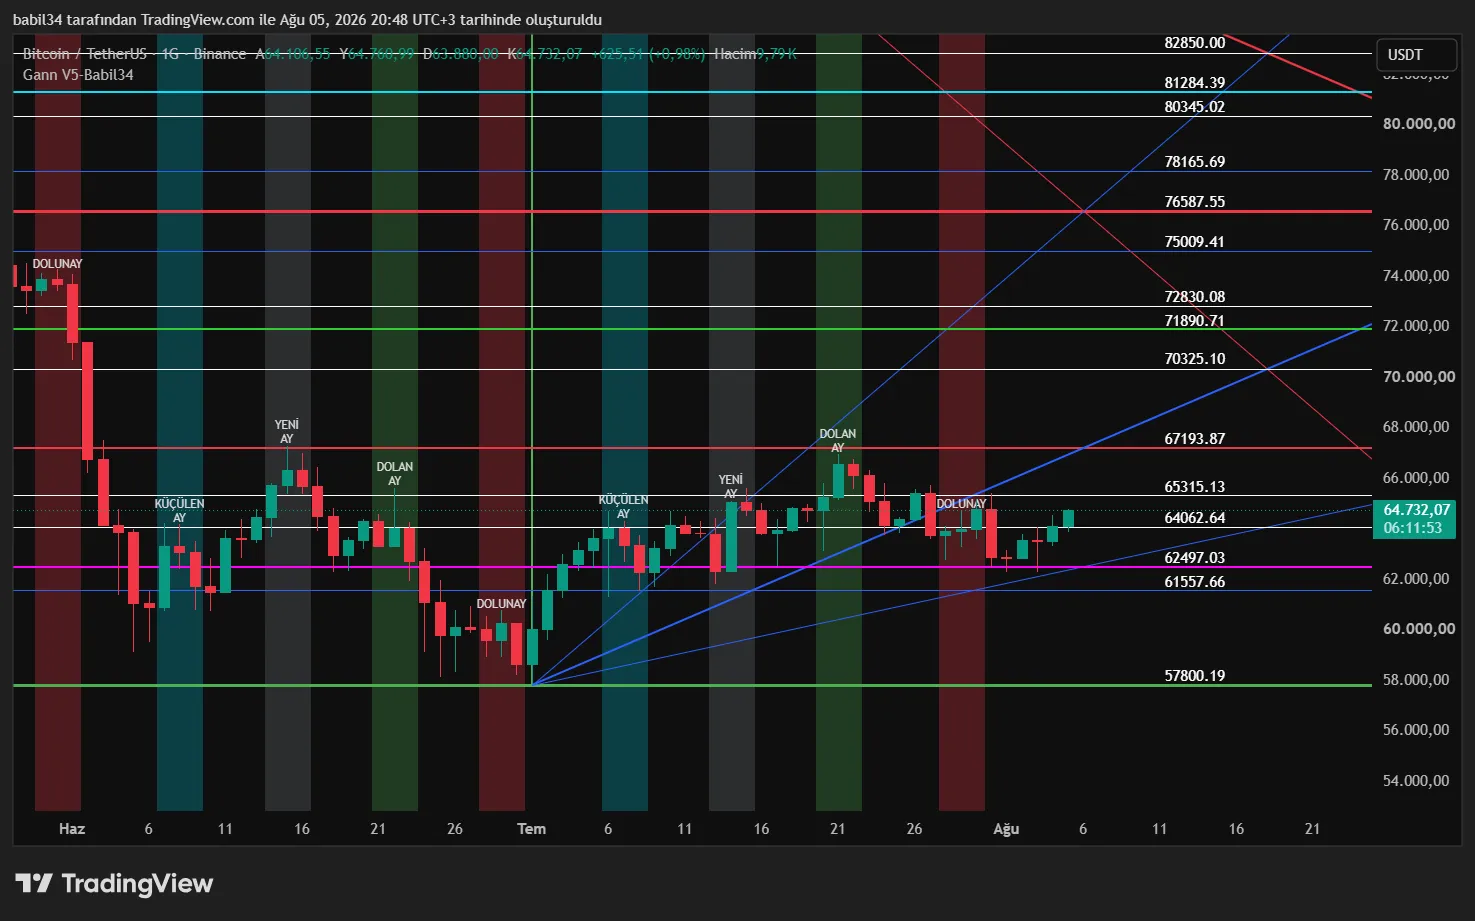
The equinoxes and solstices are the main seasonal reference points for looking for reversals in the markets:
- Mar 20/21 - Around the spring equinox; treated as the starting window of the annual cycle.
- Jun 21 - The summer solstice.
- Sep 22/23 - Around the autumn equinox.
- Dec 21 - The winter solstice.
Angular cycles: Viewing the calendar year as a 360-degree circle, Gann argued that reversals cluster at time distances of 90°, 180°, 270° and 360° from the equinoxes - with intermediate steps of 45° each. These days are followed as the annual seasonal pivot days.
The table below lists the dates followed in the Gann literature. They should be read not as a "guarantee of typical behaviour" but as date windows to be tested separately on historical data.
| Date | Season | Market behaviour |
|---|---|---|
| Mar 20/21 | Spring | Starting window of the annual cycle. |
| May 5 | Spring | An important date for a change of trend. |
| Jun 21 | Summer | Start of the season and a change of trend. |
| Jul 23 | Summer | Significant uptrends and downtrends have started on this date. |
| Aug 5 | Summer | This date should be treated as an approximate marker for many of the tops and bottoms seen in the markets. |
| Sep 22/23 | Autumn | The halfway point of the annual cycle, around the autumn equinox. |
| Nov 8 | Autumn | Many important record highs and lows fall on this date. |
| Nov 22 | Autumn | A date on which changes of trend have been observed. |
| Dec 21 | Winter | Important changes of trend have occurred on this date. Extreme highs and lows have been observed. |
| Feb 4 | Winter | Minor changes have been observed on this date. |
Are These Calculations Done by Hand?
The calculations above can be done by hand; however, selecting pivots on every chart, drawing the angles, dividing the box and comparing date windows takes time. A sound working order looks like this:
- Clearly select the main low or high to be measured and the time range of the data.
- Calculate the price and time ratios according to the scale of the chart.
- If more than one ratio points to the same area, record it as a "watch zone".
- Test the scenario on past data and in different markets; do not tie a trading decision to a single line.
To speed up this process, Gann V5-Babil34 places the levels, angles, fans and time cycles on the chart. The system speeds up the calculation; it does not make the pivot selection, read the market context or manage risk on the user's behalf.
For those who want to learn the logic of the method hands-on, I offer one-to-one training: we first look at how the measurement is made, and then at the conditions under which it can be valid or misleading.

More than twenty years of market experience, specialising in Gann analysis. Builds TradingView indicators and MetaTrader 5 automation software, and teaches one-to-one.
About →