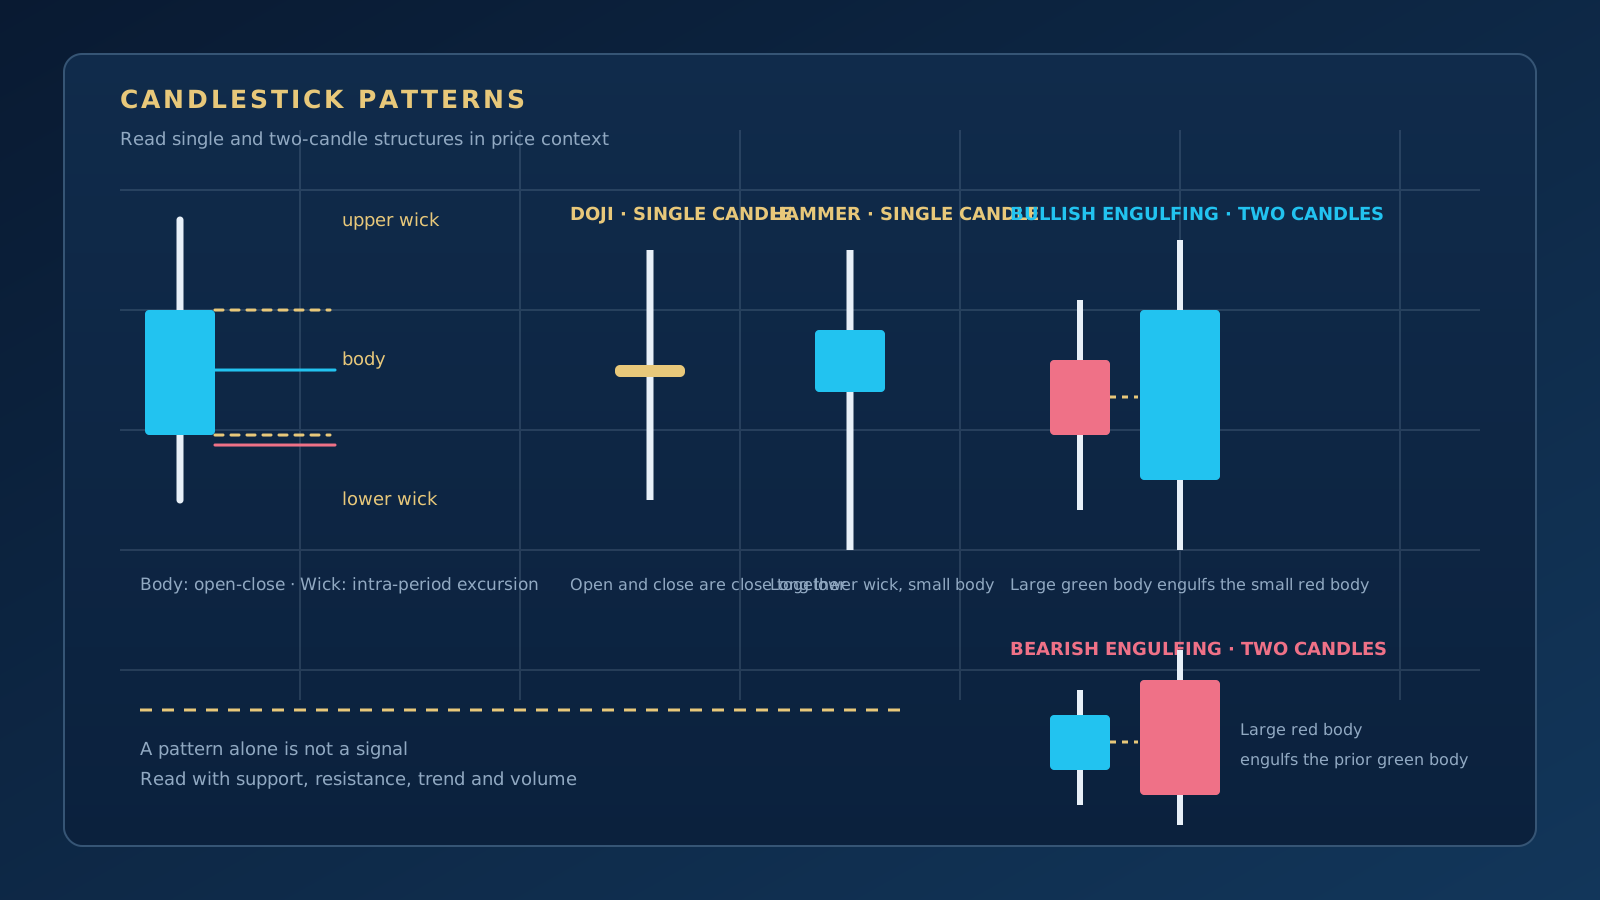
Candlestick patterns are a visual way of describing how price moved within the selected timeframe. Each candle shows the open, close, high and low. The length and position of the body and the wicks can give an idea of the struggle between buyers and sellers during that period.
A single candle does not guarantee future movement. The same pattern can mean different things at a support zone, at resistance or in the middle of a strong trend. That is why candles should be read in the context of technical analysis, trend, key levels and volume.
The Body and the Wick
The body is the distance between the open and the close. If the close is above the open, the candle is drawn in the bullish colour; if it is below, in the bearish colour. The wicks show how far price travelled beyond the body during the selected timeframe.
- Long body: May suggest that directional movement was pronounced during that period.
- Long upper wick: Can point to an area where higher prices were rejected.
- Long lower wick: Can indicate that buyers may have stepped in at lower prices.
- Small body: Tells you the open and close were close together and that indecision increased.
What Is a Doji?
A doji is a candle whose open and close are very close to each other. Price moved up and down during the period but ended near where it started. For this reason the doji can be watched as a sign of indecision.
The meaning of a doji depends on where it forms. A doji at a resistance zone and a doji in the middle of a sideways market do not send the same message. The close of the next candle and the behaviour of volume should be examined separately.
Hammer and Inverted Hammer
A hammer is a candle with a small body and a long lower wick, usually seen after a decline. It may suggest that lower prices were rejected. In an inverted hammer the upper wick is longer, showing an attempt to push higher.
These patterns are not reversal signals on their own (confirming momentum, especially with ALA V2, is important). Look for confirmation from a support zone, the close of the next candle and, where possible, volume.
Bullish and Bearish Engulfing
An engulfing pattern consists of two candles. In a bullish engulfing, the body of the previous bearish candle sits inside the body of the following bullish candle. A bearish engulfing is the reverse. The body of the second candle is large enough to cover the previous body completely.
- Bullish engulfing: A scenario in which buyers may have gained strength after a period of selling pressure.
- Bearish engulfing: A scenario in which sellers may have gained strength after a period of buying pressure.
To decide whether the pattern is genuinely meaningful, check the level where it formed and the price behaviour that followed.
Pin Bars and Rejection Candles
A pin bar is a candle structure that shows clear rejection, with a long wick in one direction and a smaller body at the other end. When it forms at support or resistance, it can be read as price refusing to accept that zone.
A long wick does not always mean a reversal. News-driven volatility, low liquidity or a brief stop hunt can create a similar picture.
Where Are Candlestick Patterns More Meaningful?
Before interpreting a pattern, ask where price is. Support and resistance zones, trend lines and previous highs and lows provide the context for the candle.
- At support: A lower wick or a bullish engulfing may suggest the possibility of a buyer reaction.
- At resistance: An upper wick or a bearish engulfing can indicate growing selling pressure.
- Mid-trend: The same candle may be nothing more than a short-lived pullback.
- On a strong breakout: A long body and rising volume can support a continuation scenario.
Confirmation with Volume and the Close
Where a candle closes matters as much as its shape. A strong candle that closes above resistance is different from one that only pierced it with a wick. A rise in volume can also help you judge whether the move happened with more participation than in the previous period.
A pattern that forms on low volume should be tested more carefully. High volume, however, does not automatically mean movement in the right direction; panic and position closing can also push volume higher.
Candles Across Different Timeframes
A single candle on the one-hour chart is only a small piece of the daily chart. Lower timeframes produce more patterns, but also more noise. Higher timeframes offer broader context, but fewer signals.
Examining direction and levels on the higher timeframe first, and then the candle structure on the lower timeframe, gives a more consistent working order.
Common Beginner Mistakes
- Treating every hammer as a reversal: The level and the trend where the pattern forms must be checked.
- Not waiting for the close: A candle that is still forming does not carry the same information as a closed one.
- Confusing the wick with the body: Rejection and a directional close are different behaviours.
- Looking at a single timeframe: The larger trend can change the meaning of a small pattern.
- Not setting a stop: You should know in advance where the scenario is invalidated if the pattern fails.
Quick Summary
Candlestick patterns help you read the balance between open and close, and the rejections, within a given period. Doji, hammer, pin bar and engulfing candles are not trade signals on their own; they should be evaluated together with trend, support and resistance, the close and volume.
To learn the basics of chart reading, continue with What Is Technical Analysis?, and to understand price zones, read What Are Support and Resistance?.
More than twenty years of market experience, specialising in Gann analysis. Builds TradingView indicators and MetaTrader 5 automation software, and teaches one-to-one.
About →