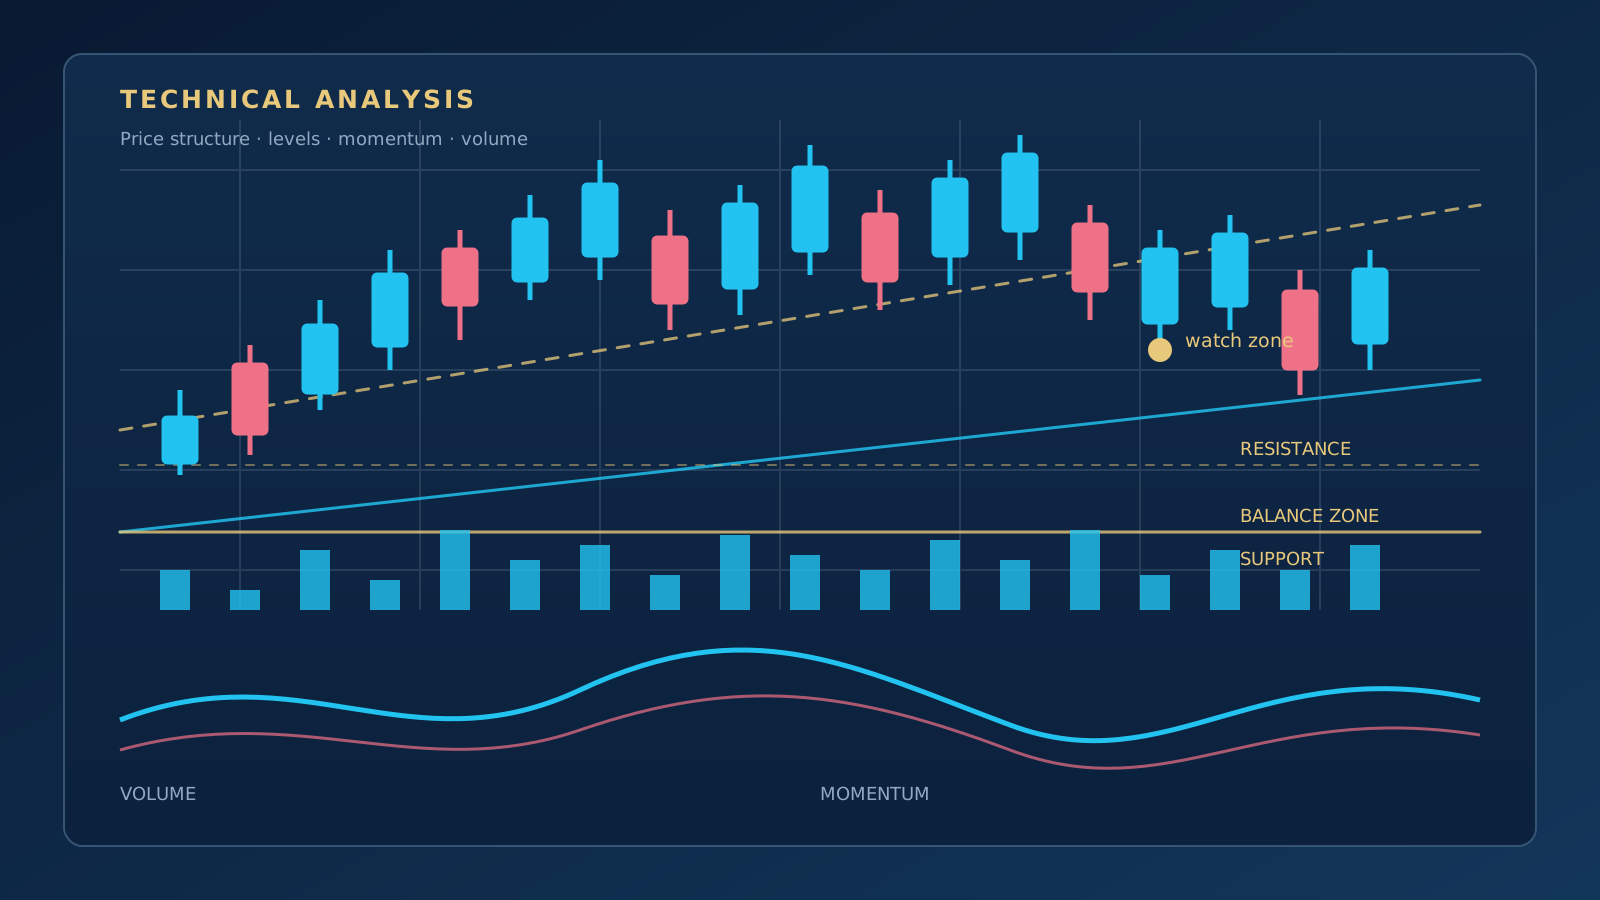
Technical analysis is a method of evaluating possible market scenarios by studying the historical price and trading data of a financial asset. The main goal is not to know the future with certainty, but to define in advance which direction price is moving, where it has reacted and under what conditions the idea should be considered invalid.
For that reason, technical analysis is not simply a matter of adding an indicator to a chart. A sound analysis requires market structure, trend, support and resistance, momentum, volume and risk management to be read together. The guide below helps beginners establish that order.
What Is Technical Analysis For?
A chart is the trace that the decisions of buyers and sellers leave on price. Technical analysis reads that trace to answer three fundamental questions:
- Direction: Is price in a rising, falling or sideways structure?
- Level: Where have buyers or sellers previously gained strength?
- Scenario: If price does not move in the expected direction, at what point does the analysis become invalid?
The purpose of these questions is not to increase the number of trades, but to turn uncertainty into a manageable plan. Technical analysis is not a prophecy; any interpretation can turn out to be wrong, and that possibility must be accepted at the very start of the trading plan.
Where to Start Reading a Chart
The most common beginner mistake is to start too close to the chart and with too many indicators. A healthier approach is to read the big picture first and the details afterwards:
- Decide which market and timeframe you are trading.
- Mark the most recent clear lows and highs.
- Check whether price is producing higher highs and higher lows or lower highs and lower lows.
- Note the important price zones as support and resistance.
- Finally, test the scenario against the latest momentum and volume data.
This order prevents the indicator from becoming more important than the chart itself. Indicators help explain price; they do not replace price behaviour.
What Is a Trend?
A trend is the direction price has predominantly followed over a period of time. An uptrend shows higher highs and higher lows, while a downtrend shows lower highs and lower lows. In a sideways market this structure is not clear; price usually moves back and forth within a band.
A trend line or moving average can give an idea of direction, but on its own it does not prove that the trend will continue. The strength of a trend should be assessed together with a breakout confirmed by the close, trading volume and the structure on the higher timeframe.
How to Identify Support and Resistance
Support is the price zone where buyers have previously gained strength during a decline; resistance is the zone where sellers have previously come forward during a rally. These are usually areas covering several prices rather than a single line.
- Levels that have been tested more than once deserve more attention.
- Broken resistance can be watched as support on the next move; this is not a guarantee.
- The older a level is, the more it needs to be re-tested against current market conditions.
- A brief overshoot by a wick and a breakout confirmed by a close should be kept apart.
Support or resistance is not an order instruction. When price reaches the zone, it should be observed separately which scenario unfolds: a reaction, a breakout or indecision.
What Do Volume and Momentum Tell You?
Volume provides information about the intensity of trading over a given period. Price clearing an important level on high volume suggests there may be more participation behind the move. Low-volume breakouts should be tested more carefully.
Momentum is used to assess the speed and strength of a price move. Indicators such as RSI and MACD can be used to read momentum; but both are derived from past price data. As a result, they do not predict the future on their own, and in strong trends they can remain in overbought or oversold territory for a long time.
How Should Indicators Be Used?
When choosing an indicator, ask "which question am I trying to answer?" before asking "which indicator is the best?":
- Trend: Moving averages or trend-based indicators can help track direction.
- Momentum: RSI, MACD or oscillators can be used to study changes in speed and strength.
- Volatility: Bands and ATR-based measurements can help gauge the size of moves.
- Time: Methods such as the Gann approach study price movement together with the time elapsed.
Stacking five indicators that produce the same information does not improve the quality of an analysis. A better setup is to choose a small number of components that answer different questions and to know when each of them can be misleading.
Risk Management in Technical Analysis
Even an analysis that looks good can turn out to be wrong. That is why risk management is not a detail added after the analysis, but part of the analysis plan. Before entering a trade, the answers to these questions should be written down:
- At which price or structural break does my idea become invalid?
- How much of my account am I risking on this trade?
- Is there a reasonable ratio between the expected gain and the risk taken?
- Could news, liquidity, spread or leverage change the outcome?
Past performance is no guarantee of future results. In leveraged markets especially, even small price moves can turn into large losses. Before trading a live account, the method should be tested on historical data and, where possible, in a demo environment.
Where Does Gann Analysis Fit in Technical Analysis?
Gann Analysis is one of the specialised approaches within technical analysis that evaluates price and time together. Gann angles, fans, price levels and time cycles aim to study not only where a move is going, but at what speed and over how much time it is progressing.
This approach does not have to be an alternative to classic trend, level and momentum readings. While price structure offers a direction and a zone, price-time analysis can help evaluate the timing of that move. Neither approach should be accepted as a definitive signal without testing.
Common Beginner Mistakes
- Using too many indicators: Indicators that repeat the same information make decisions harder.
- Looking at a single timeframe: A short-term signal can conflict with the trend in the big picture.
- Opening a trade before the breakout: Touching a level does not mean the level has broken.
- Not defining the loss in advance: Without an invalidation point, a plan turns into hope.
- Trusting a chart that looks good in hindsight: Real-time conditions and trading costs must be accounted for separately.
Quick Summary
Technical analysis is a systematic way of thinking used to make sense of price movements. Read market structure and trend first, then support and resistance zones, then volume and momentum data. Finally, define the point at which the scenario becomes invalid and the risk you are willing to take.
Once this foundation is in place, price-time approaches such as Gann Analysis become easier to understand. The goal is not to use more lines, but to know which question each measurement answers.

More than twenty years of market experience, specialising in Gann analysis. Builds TradingView indicators and MetaTrader 5 automation software, and teaches one-to-one.
About →