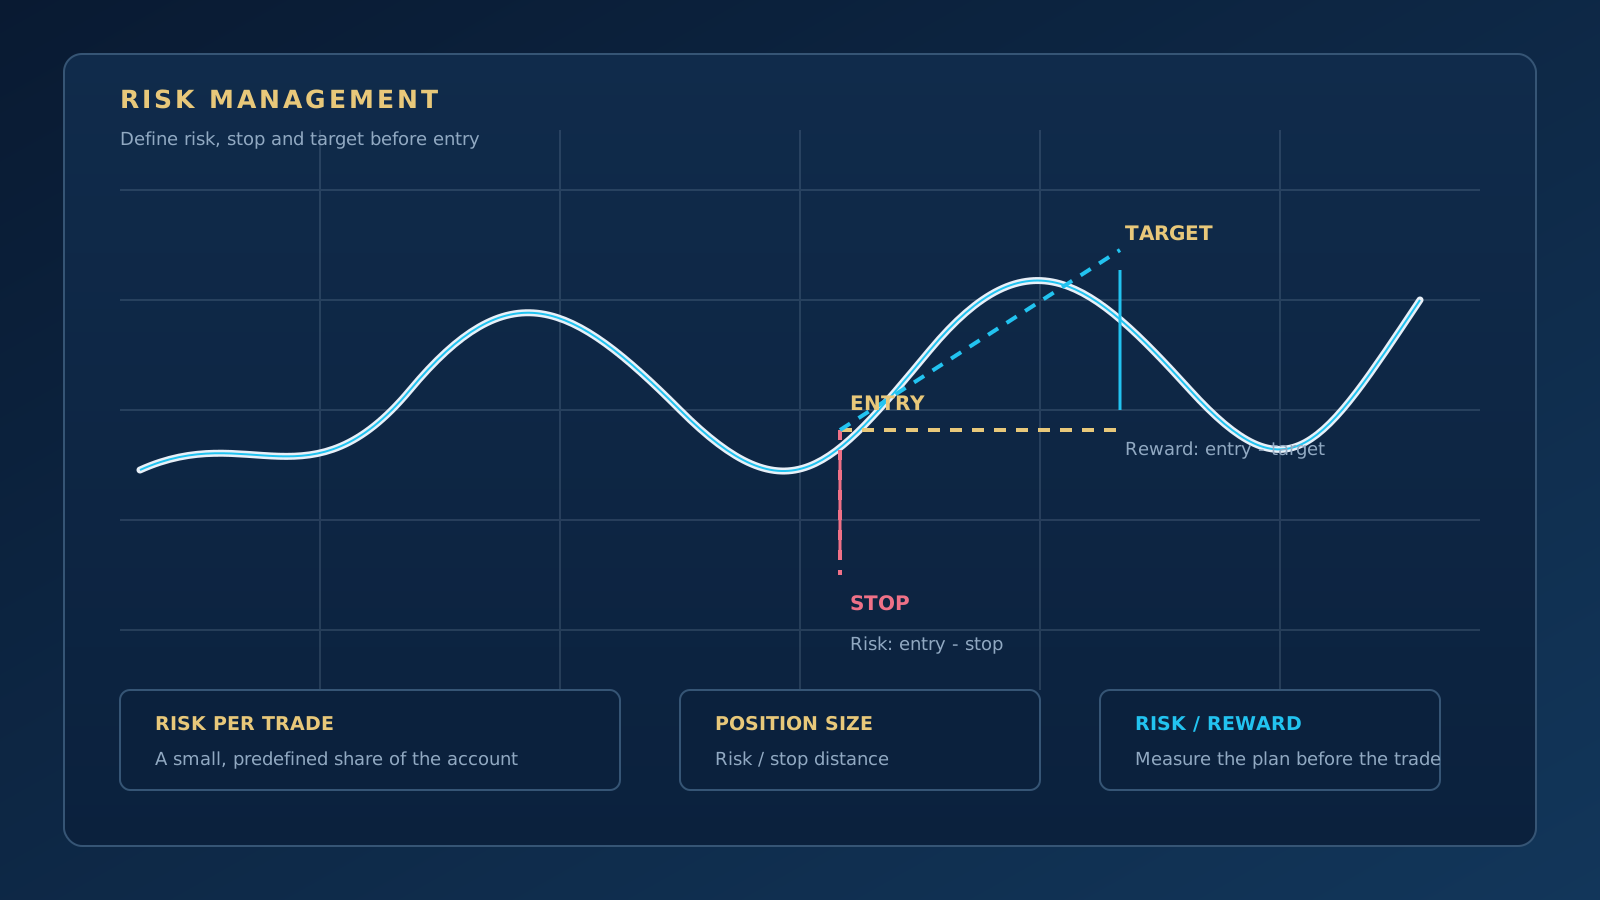
Risk management is the method of limiting, in advance, how much the account will lose when a trade idea turns out to be wrong. Technical analysis produces a scenario about entry direction and possible levels; risk management defines the plan to follow if that scenario is invalidated.
Risk management does not guarantee profits. Its purpose is not to make every trade a winner, but to prevent a single mistake or a short string of losses from making the trading plan and the account unsustainable.
What Is Risk per Trade?
Risk per trade is the maximum loss accepted on a position if the stop level is reached. This amount should be set before the trade is opened, either as a money amount or as a percentage of the account. When choosing the risk percentage, consider the market, leverage, trading frequency and your personal tolerance for losses together.
For example, risking a small percentage of the account can leave more room to recover after losing trades. There is no single "correct" percentage, however; what matters is applying the chosen rule consistently.
How Is Position Size Calculated?
Position size is not simply how much money you trade with. Entry price, stop distance and the accepted risk are evaluated together. The simplified approach:
Position size = accepted risk amount / risk per unit to the stop
As the stop distance widens, the position shrinks in order to keep the same money risk. As the stop distance narrows, the position can grow; however, very tight stops can be triggered unnecessarily by normal market fluctuation. Commission, spread and slippage must also be taken into account.
How Is a Stop-Loss Determined?
The stop-loss defines the level at which the technical scenario is considered invalid. Instead of using a random percentage, take into account the support and resistance zone, trend structure, volatility and the timeframe of the trade.
- Structure-based stop: Price breaking a specific low, high or zone invalidates the scenario.
- Volatility-based stop: Measures such as ATR can help leave room for normal price fluctuation.
- Time stop: If price does not show the expected behaviour within the set period, the position is reassessed.
Repeatedly moving the stop further away can change the risk that was accepted at the start. The location of the stop, and the conditions under which it may be changed, should be written down before the trade is opened.
What Is the Risk-Reward Ratio?
The risk-reward ratio is the targeted gain relative to the risk taken. The distance between entry and stop is measured as risk, and the distance between entry and target as the planned reward.
A higher ratio does not always mean a better trade. If a distant target has a low probability of being reached, the plan looks good on paper but may be unsustainable in practice. The target should be chosen in line with market structure, support and resistance, and volatility.
Is Win Rate Enough on Its Own?
Win rate shows how many trades closed in profit, but on its own it does not describe the quality of a strategy. Average win, average loss, commission, slippage and trading frequency must also be taken into account.
A method with a low win rate can be sustainable if it keeps its large wins. A method with a high win rate can produce poor results because of rare but large losses. That is why results should be tested over a sufficient number of trades and with realistic costs.
How Does Leverage Increase Risk?
Leverage allows you to control a larger position with a smaller margin; it does not remove risk. A small move in price can affect a large part of the margin. Spread widening, falling liquidity, gaps and fast news-driven moves can cause the stop to be filled at a worse price than expected.
Automated trading in particular also carries technical risks such as connection loss, broker delays or platform problems. Automation software such as Babil34 FX does not eliminate these conditions; the user must define their own risk limits separately and test the system on a demo account first.
Why Are Backtesting and Demo Testing Important?
A backtest lets you look at a setup on historical data; it does not guarantee the same result in the future. The choice of historical data, commission, spread, slippage, liquidity and order execution conditions can change the outcome.
Demo testing helps you observe the strategy and the platform workflow without risking real money. However, there can be differences between a demo and a live account in terms of psychology, liquidity and trading costs.
A Plan for Consecutive Losses
A string of losses can occur even as the normal outcome of a strategy. Consider this possibility from the start:
- After a set number of consecutive losses, reduce trade size or take a break.
- Set a maximum daily or weekly loss limit.
- Do not increase position size without a plan in order to recover a loss.
- In your trading journal, separate losses that followed the plan from losses caused by rule violations.
Using It Together with Technical Analysis
Technical analysis can offer an entry scenario. Support and resistance zones help shape the stop, a trend line helps assess market direction, and volume helps evaluate participation in the move. No indicator replaces a risk limit.
Before entering a trade, write down these four pieces of information: the entry condition, the invalidation/stop point, the target scenario and the accepted loss. If they are missing, the analysis has not yet turned into an actionable trading plan.
Beginner Mistakes
- Moving the stop further away: Increases the risk as price moves against you.
- Trying to recover a loss: Increasing position size without a plan can accelerate the loss.
- Not treating leverage as risk: A small margin does not mean a small risk.
- Treating backtest results as a guarantee: Past performance does not indicate future results.
- Forgetting trading costs: Spread, commission and slippage affect the net result.
Quick Summary
Risk management means defining, before opening a trade, the loss you accept and what you will do when the scenario is invalidated. Position size should be adjusted to the stop distance; the target, costs, leverage, consecutive losses and test results should be evaluated together.
Good technical analysis only turns into a real trading plan when it is paired with a measurable and limited risk plan. The goal is not to find trades without losses, but to keep losses under control.

More than twenty years of market experience, specialising in Gann analysis. Builds TradingView indicators and MetaTrader 5 automation software, and teaches one-to-one.
About →