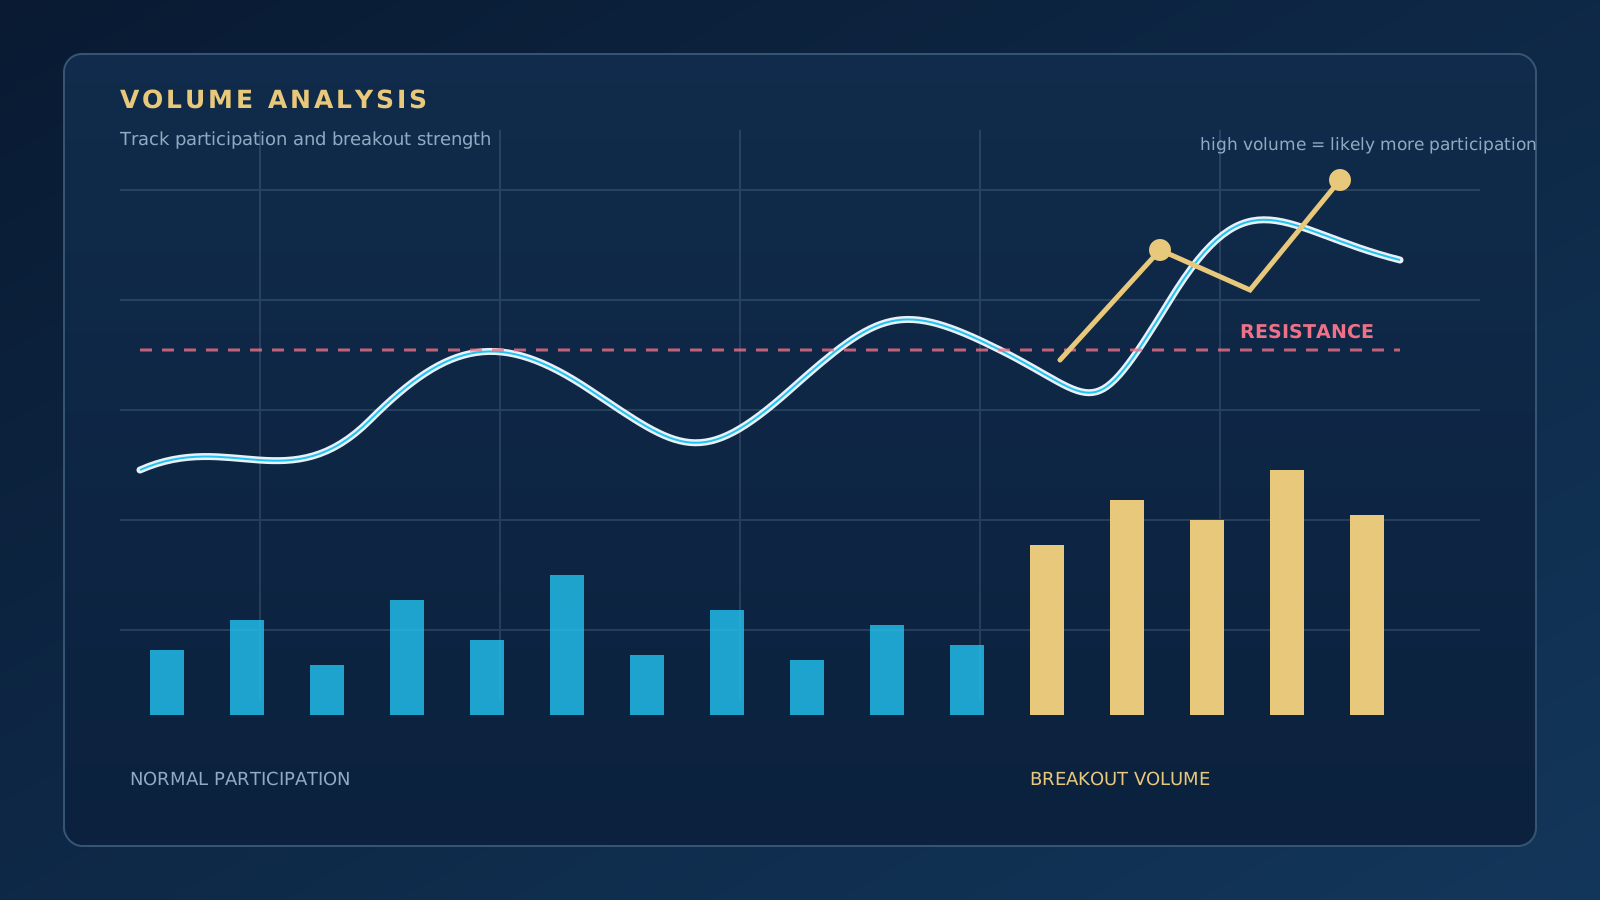
Volume analysis is the practice of studying trading activity over a given period alongside the price action itself. It adds a layer of information about whether participation is growing as price rises or falls, and whether there is genuine interest behind a move.
Volume on its own is not a buy or sell signal. High volume can reflect a strong trend, but it can also reflect panic selling, position liquidation or a short-lived, news-driven spike. A meaningful reading requires the price level, the candle close and the wider market context to be considered together.
What Is Volume?
Volume represents the amount of trading, or in some markets the trading activity, that took place during the selected timeframe. Stock and futures markets report actual traded volume, while forex charts usually show tick volume supplied by the broker. In crypto markets, the measurement can vary by exchange and data provider.
Because of these differences, volume figures from different markets should not be compared directly. It is far more reliable to compare the same symbol, on the same data source, against its own historical average.
How to Read Price and Volume Together
- Price rises, volume rises: Participation in the advance may be strengthening; still check the level and the close.
- Price rises, volume falls: Participation in the move may be fading; this alone is not a reversal signal.
- Price falls, volume rises: Selling pressure or the possibility of panic is worth examining.
- Price flat, volume rises: Positions may be changing hands ahead of a larger move.
These readings produce probabilities, not certainties. Rather than interpreting the volume of a single candle, it is more meaningful to compare volume against its own moving average and against earlier periods.
Why Does Breakout Volume Matter?
When a support or resistance zone is broken, volume helps show whether participation in the breakout has increased relative to the preceding period. A close above resistance on high volume can make the breakout scenario more noteworthy. A low-volume breakout, on the other hand, means the risk of price returning into the zone needs closer monitoring.
A rise in volume does not guarantee a breakout. News, a session open or a single large order can also push volume higher. That is why the following candles should be checked to see whether price holds above the zone.
Low-Volume Moves and False Breakouts
If price pushes through an important level while volume stays below its recent average, participation in the market may be limited. When price returns into the zone shortly afterwards, the case for a false breakout becomes stronger.
That said, low volume does not always mean weakness. During low-liquidity hours, or in periods when normal market volume is reduced, this picture can be perfectly ordinary. Always compare volume against the history of the same symbol and the same timeframe.
What Is Volume Profile?
Volume profile displays trading activity across price levels instead of along the time axis. This makes it possible to see which price ranges attracted the most trading. Areas of heavy activity can be watched as zones where price may show indecision or acceptance when it returns.
Density in the profile does not translate into guaranteed support or resistance in the future. New information, a change in trend and different data ranges can all change how much the profile matters.
OBV and Other Volume Indicators
OBV (On-Balance Volume) adds or subtracts volume cumulatively depending on the direction of each close. When price and OBV move in different directions, a price-volume divergence can be investigated.
Chaikin Money Flow, Volume Weighted Average Price (VWAP) and volume moving averages can each answer different questions. Instead of stacking many indicators, first decide which question you want answered: participation, average price, or a divergence between price and volume?
How Volume Differs in Crypto, Stocks and Forex
- Stocks: Session hours and the reported actual traded volume matter.
- Crypto: The market is open 24/7, so the choice of exchange and data provider affects the result.
- Forex: There is no central exchange, so charts typically show tick volume; this is not the same as actual traded quantity.
A volume threshold that works in one market may not carry over to another. The normal volume range needs to be observed separately for each symbol.
How Volume Analysis Combines with Support and Trend
Read volume together with the zone price is trading in, not in isolation. For example, a close above a resistance zone combined with rising volume can make the breakout scenario worth following. On a trend line break, volume can likewise help show whether participation in the move differs from the norm.
Even when these measurements all point the same way, there is no guarantee for a trade. The invalidation point, position size and stop-loss should be defined in advance.
Common Beginner Mistakes
- Treating the highest volume bar as a buy signal: Volume also spikes during panic selling.
- Comparing different markets: The source and calculation method of volume data can differ.
- Deciding on a single candle: Volume should be compared against a period and an average.
- Not waiting for the breakout close: A wick and a sustained close are two different things.
- Leaving the risk plan to volume: Volume is no substitute for a stop-loss or position sizing.
Quick Summary
Volume analysis helps evaluate the participation behind a price move. The healthiest way to use it is to compare volume against its own average, take support, resistance and trend structure into account, watch the closes after a breakout and know what kind of volume data the market provides.
To build the foundations of technical analysis, continue with What Is Technical Analysis?, and to understand price zones, read What Are Support and Resistance?.

More than twenty years of market experience, specialising in Gann analysis. Builds TradingView indicators and MetaTrader 5 automation software, and teaches one-to-one.
About →